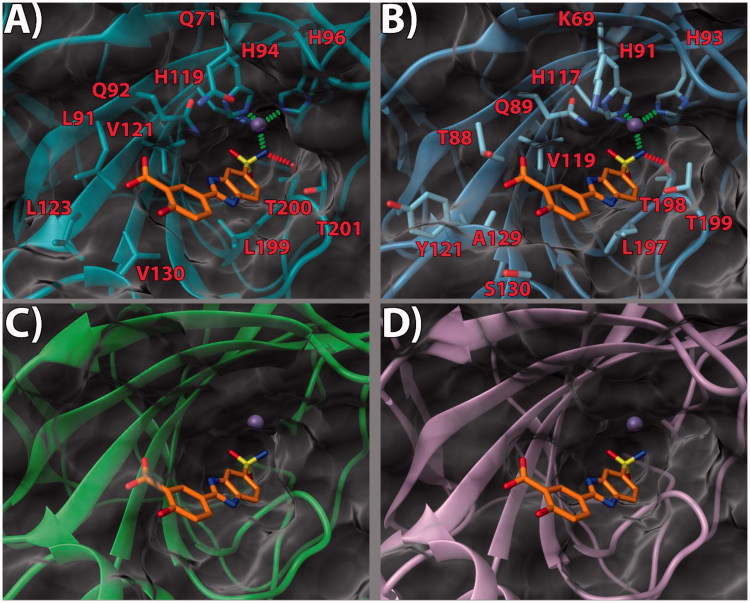
Figure 3.
(a) 14/hCA IX (PDB 5FL4) theoretical complex as calculated by docking simulations. The protein is shown as cyan ribbons and sticks while the ligand as orange sticks. Critical residues are labeled. H-bonds are depicted as red dashed lines while coordination bonds as green dashed lines. (b) 14 hCA IX theoretical binding pose within the hCA XII (PDB 5MSA) X-ray structure. The protein is shown as light blue ribbons and sticks while the ligand as orange sticks. Critical residues are labeled. H-bonds are depicted as red dashed lines while coordination bonds as green dashed lines. (c) 14 hCA IX theoretical binding pose within the hCA I (PDB 6F3B) X-ray structure. The protein is shown as green ribbons and its molecular surface as transparent gray. The ligand is shown as orange sticks. (d) 14 hCA IX docked binding pose within the hCA II (PDB 3K34) structure. The protein is shown as pink ribbons and its molecular surface in transparent gray. The ligand is depicted as orange sticks. The images were rendered using the UCSF Chimera software30.

