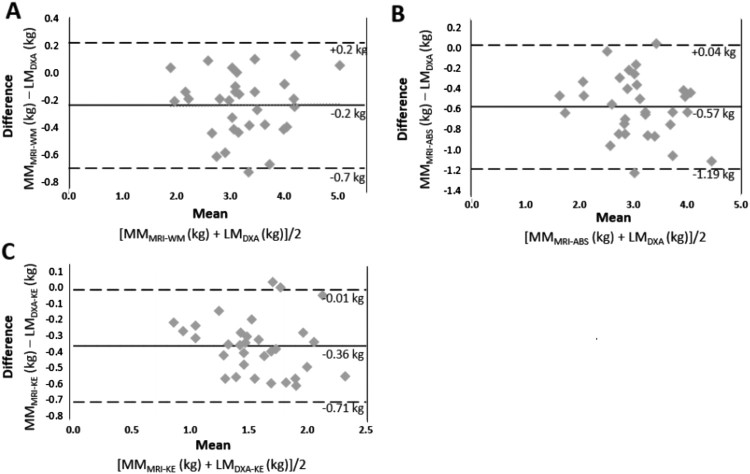
Figure 3.
(A) Bland-Altman analysis between LMDXA and MMMRI-WM. In each plot, the difference between the values obtained from DXA and MRI is plotted along the y-axis and the average of the measurements is plotted along the x-axis. The solid line represents the mean difference between measurements and dashed lines represent 2 SD above and below the mean difference. (B) Agreement between LMDXA and MMMRI-ABS after excluding IMF. (C) Bland Altman plots between LMDXA-KE and MMMRI-KE.

