Fig. 1.
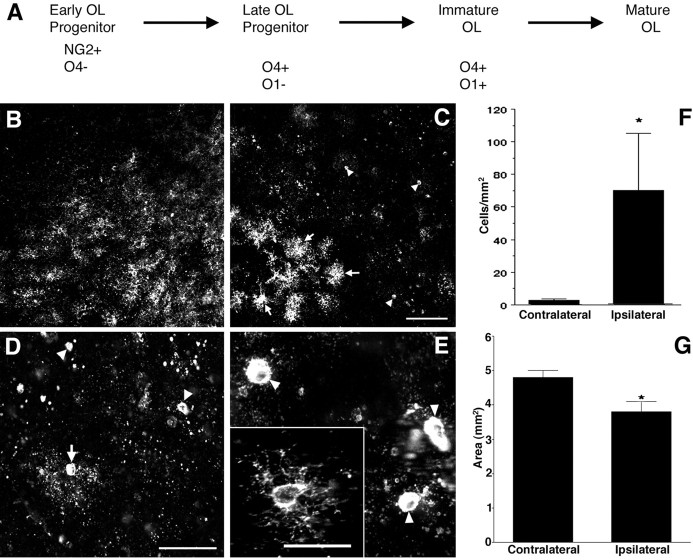
Susceptibility of late OL progenitors to H-I at P2. A, The four successive stages in the OL lineage are depicted at the top. Shown at the bottomare the markers that were applied to define each stage.B, The normal low-power distribution of O4-labeled cells in the corpus callosum in the control hemisphere. C, The ischemic corpus callosum contralateral to that in Bcontains numerous pyknotic O4-labeled cells (arrowheads). Adjacent to the infarct (bottom left) are numerous intensely labeled cells (arrows). These apparent reactive cells are discussed in the context of Figure 4. D, Pyknotic cells at various stages of degeneration. A halo of degenerating processes surrounds one pyknotic cell (arrow). Many pyknotic cells (arrowheads) at a more advanced stage of degeneration had no discernible processes. E, High-power detail of pyknotic OL progenitors (arrowheads). Typical morphology of a control cell (inset). F, The density (cells per square millimeter) of pyknotic late OL progenitors in the ischemic (Ipsilateral) hemisphere was significantly increased relative to the control (Contralateral) hemisphere (*p = 0.05; unpaired Student's ttest). G, One week after H-I at P2, the area of the ischemic (Ipsilateral) corpus callosum was significantly decreased by ∼20% (*p = 0.0004; unpaired Student's t test). Scale bars:B, C, 100 μm; D, 50 μm; E and inset, 25 μm.

