
Fig. 2.
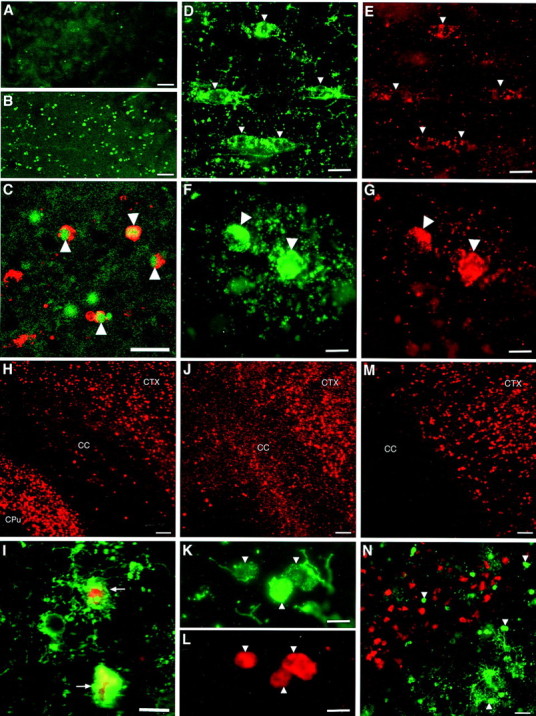
Pyknotic late OL progenitors label for markers of cell death. Numerous TUNEL-positive nuclei were detected in the ischemic corpus callosum (B) relative to control (A). C, Pyknotic O4 antibody-labeled cells (red, arrowheads) had TUNEL-positive nuclei (green).D, E, O4 antibody-labeled progenitors in the nonischemic hemisphere (D,arrowheads) displayed a punctate distribution of cytochrome c immunoreactivity in the soma and proximal processes (E). F,G, O4 antibody-labeled pyknotic OL progenitors (F, arrowheads) displayed a diffuse cytoplasmic distribution of cytochrome cimmunoreactivity (G). H, Numerous cells immunoreactive for CM1, an antibody against activated caspase-3, were visualized in the ischemic cerebral cortex (CTX) and caudate–putamen (CPu), but few were visualized in the corpus callosum (CC).I, Pyknotic O4-labeled cells at different stages of degeneration (green, arrows) were CM 1 immunoreactive. J, Numerous cells immunoreactive for fractin were visualized in the ischemic CTX and CC. Note that the CPu is not shown in this higher-power photomicrograph.K, L, Pyknotic O4-labeled cells (K, arrowheads) labeled for fractin (L). M, Numerous cells immunoreactive for the p120 antibody against a caspase cleavage product of spectrin were visualized in the ischemic CTX but were not detected in the corpus callosum. N, Higher-power detail of the junction between the cerebral cortex and the corpus callosum demonstrates that pyknotic O4 antibody-labeled cells (green, arrows) were not p120 antibody immunoreactive, in contrast to numerous apparent cortical neurons (red). Scale bars: A,B, 100 μm; C, 20 μm;D, E, 10 μm; F,G, 7 μm; H, 100 μm; I, 10 μm; J, 50 μm; K, L, 7 μm; M, 60 μm; N, 30 μm.