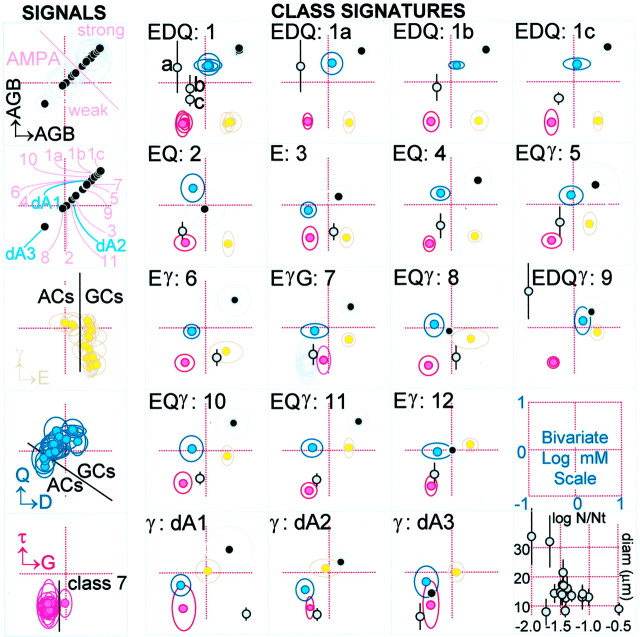
Fig. 4.
Bivariate signal plots (left column) and class signature N-plots (right four columns) that characterize classes of cells in the ganglion cell layer (case 2366). Each molecular signal or signature plot is placed on the same quantitative bivariate log millimolar scale that maps directly to pixel intensity. Each colored spotis the bivariate mean for a pair of values surrounded by a 2 SD border. In x,y axis notation,black is AGB AGB, gold isEγ, cyan is DQ,magenta is Gτ. Gray symbols map log population fraction (x = log N/Nt, where N = number of cells in class, Nt = total cells in all classes) against mean cell diameter ± 2 SD (y) on the scale in the bottom left quadrant. Left signal column, The AGB AGB signal plots (top left two frames, black symbols) reveal that the AMPA response spectrum of classes is large and index the positions in response space for each class. The Eγ signal plot shows the separation of amacrine cells from ganglion cells, especially on the E vector, and the overlap of some ganglion cells into the γ signal space of true amacrine cells. The DQ plot similarly shows that amacrine cells occupy the lowest portion of the signal space. This bivariate space alone is insufficient to completely segregate amacrine cells but is part of a complete separation when combined with the Eγ space. The Gτ plot reveals that class 7 ganglion cells separate on the G vector. The bottom right plot demonstrates that the large cells are the rarest, small cells are the most abundant, and all other cells are clustered between.Right four signature columns, The class signature plots are N-plots, encoding the same five signal pairs (AGB AGB, Eγ, DQ, Gτ, fraction-size) for each of 15 classes.

