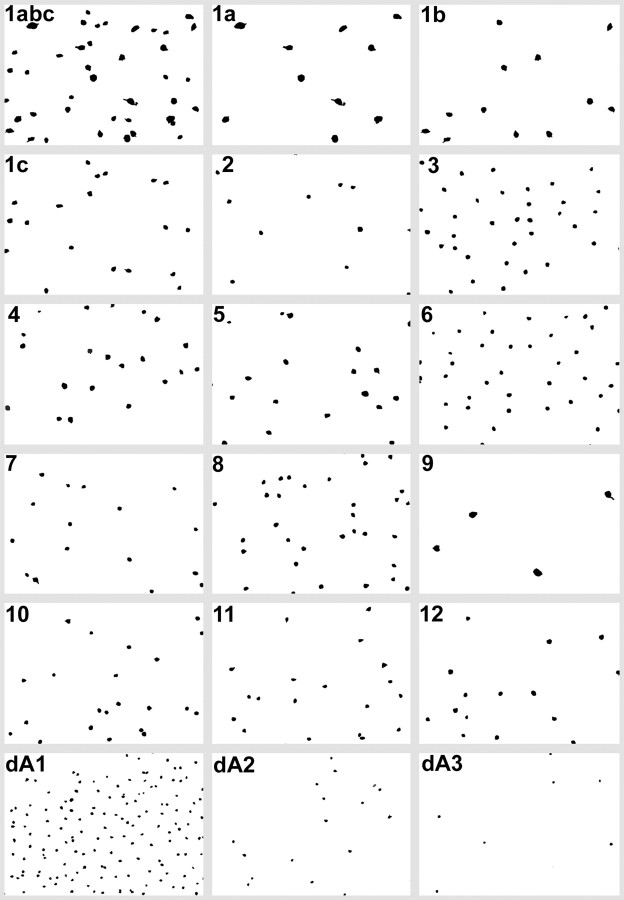
Fig. 5.
Separated patterns of cell classes derived from the registered array of seven serial 250 nm sections. Class 1 contains a mixture of cell sizes that are separable by deconvolution into classes 1a, 1b, and 1c. Class pairs 9 and 5 and 10 and 11 were not completely separated by the isodata algorithm and were resolved by deconvolution of their GABA signals.

