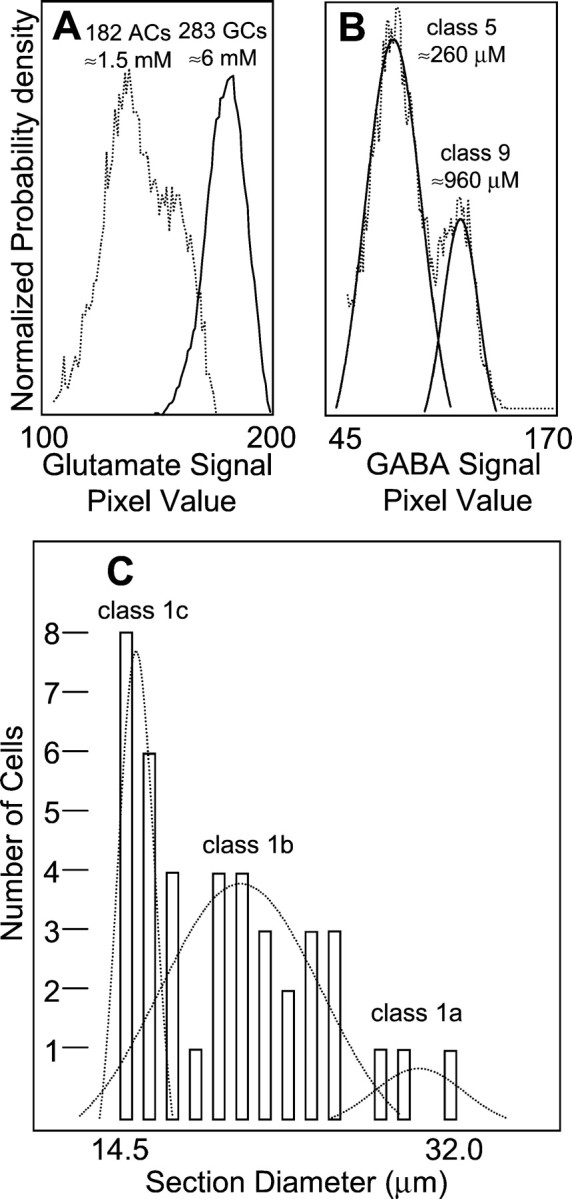
Fig. 6.

Univariate histograms and histogram deconvolution.A, Peak normalized probability density profiles for glutamate signals in displaced amacrine cells (dotted line) and ganglion cells (solid line).B, Deconvolution of the GABA signal histogram (dotted line) for superclass EDQγ into Gaussian components representing class 5 (EQγ) and class 9 EDQγ ganglion cells (solid lines). C, Deconvolution of the cell size histogram for superclass EDQ, class 1 ganglion cells into three components of identical shape and varying peak height (dotted lines).
