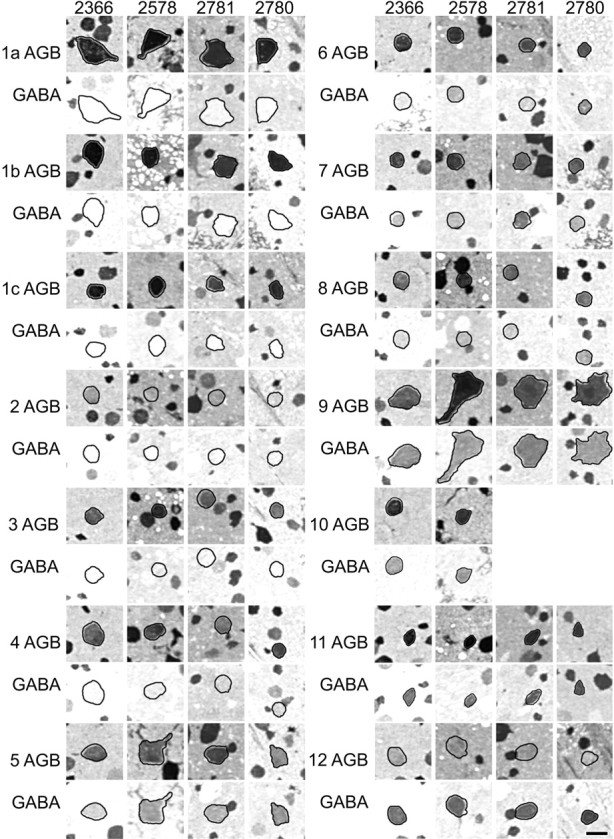
Fig. 8.

An array of GABA and AGB signals in four retinas. All panels were captured under identical conditions from horizontal 250 nm sections after registration and classification of cells. The outline of each cell was captured in a registered taurine channel (Fig. 2G) and used to track its location in both AGB and GABA channels. AGB signals were activated by exposure to 25 μm AMPA as described in Results. Class 10 cells were not resolved in cases2780 and 2781. Images are density scaled. Scale bar, 25 μm.
