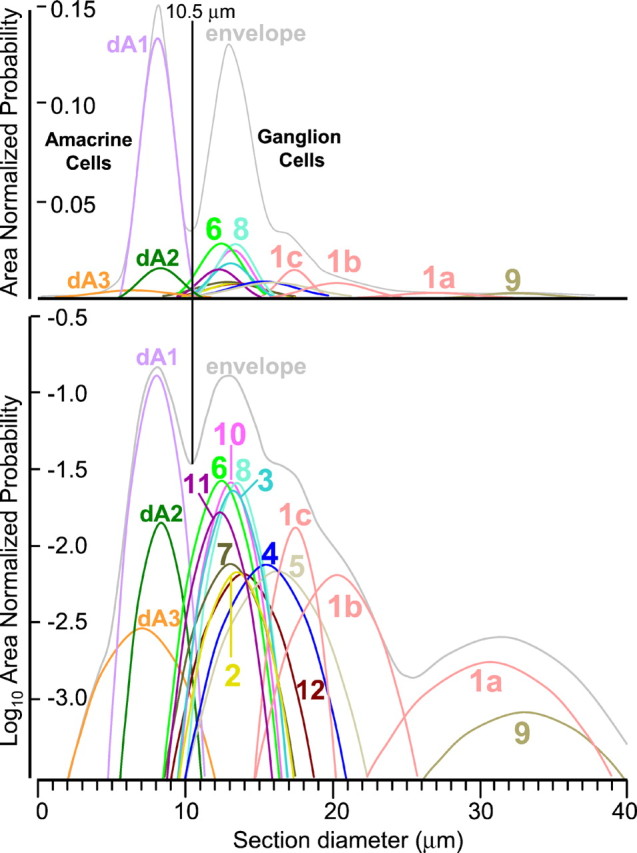
Fig. 9.

Reconstruction of the ganglion cell layer size histogram. The mean, population density, and variance of each class of ganglion cell in case 2366 was used to control the position, height, and width of a Gaussian distribution for that class. All classes were summed to create the envelope distribution and plotted on linear (A) or logarithmic (B) ordinates. The linear envelope strongly resembles typical soma size or soma area histograms plotted on linear ordinates when starburst amacrine cells are included. The logarithmic envelope and Gaussians demonstrate that the smooth peak of the envelope belies the complex mixture of cell types comprising the ganglion cell layer. At this eccentricity (∼2 mm below the streak), all cells with mean diameters <8 μm are amacrine cells on the basis of signatures.
