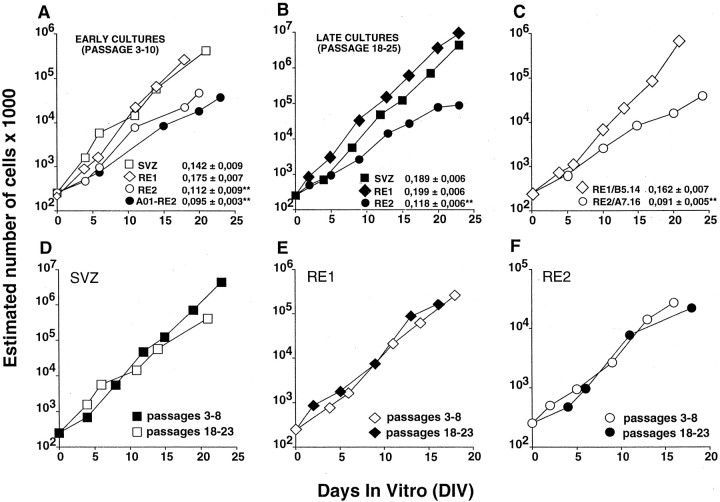
Fig. 3.
Stem cell lines established from the adult SVZ–RE display steady expansion rates. Cells were grown in the simultaneous presence of EGF and FGF-2, and growth curves were obtained (see Materials and Methods). Data were interpolated using a linear regression model and best fitted the following equation:y = a + bx, wherey is the estimated total number of cells (in log scale),x is the time (DIV), a is the intercept value, and b is the slope. The values ofb ± SE are shown in the insets inA–C. For D–F, in which the growth curves of early and late cultures from SVZ, RE1, and RE2 are compared, refer to b values shown in A andB for early and late cultures, respectively (A, B). The SVZ- and RE1-derived cell lines had closely similar expansion rates, whereas the rate for RE2-derived cell lines was slower, both for early (A) and late cultures (B). The expansion rates of RE1- and RE2-derived clonal cell lines (B5.14 and A7.16, respectively; C) and of the cell line established from surgically removed OB tissue (A01-RE2; A) closely matched those observed in bulk cultures established from the corresponding regions (A, B). Extensive subcultivation (up to 6 months in vitro) did not affect the growth characteristics of the SVZ- (D), RE1- (E), or RE2-derived (F) stem cell lines. Growth curves (early and late passages) were generated from each of three independent cultures, all of which yielded similar results. The growth curves presented are from one among the three independent cultures. The slope values were compared using a t test followed by a Bonferroni post hoc test. **Significantly different from SVZ, RE1, and RE1/B5.14; p < 0.05.

