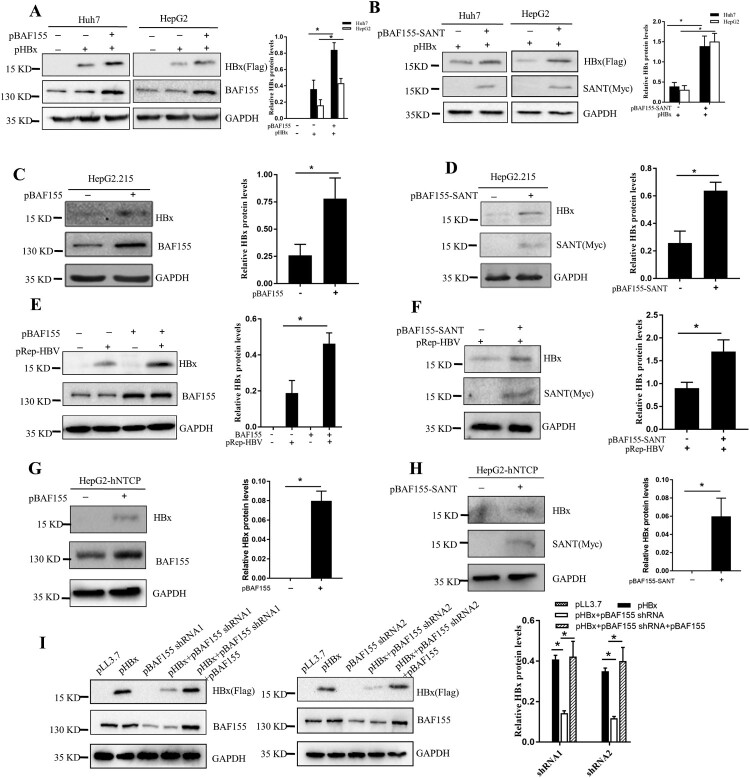
Figure 2.
Expression of BAF155 increases HBx protein levels. (A, B) The protein levels of HBx in Huh7 and HepG2 cells transfected with pBAF155 (A) and pBAF155-SANT (B). (C, D) The protein levels of HBx in HepG2.215 cells transfected with pBAF155 (C) and pBAF155-SANT (D). (E, F) The protein levels of HBx in Huh7 cells co-transfected with pREP-HBV and pBAF155 or pBAF155-SANT domain. (G, H) The protein levels of HBx in HepG2-NTCP cells transfected with pBAF155 (G) or pBAF155-SANT domain (H). (I) Knockdown of endogenous BAF155 decreased HBx protein level in pHBx-transfected Huh7 cells and re-expression of BAF155 reversed the effect. pcDNA3.1/Myc-His(-)A or pLL3.7 was used as negative control. GAPDH served as a loading control. Bar graphs are the results of densitometric analysis of western blots showing the relative expression of the proteins. Values are mean ± SD, n = 3. *p < 0.05.

