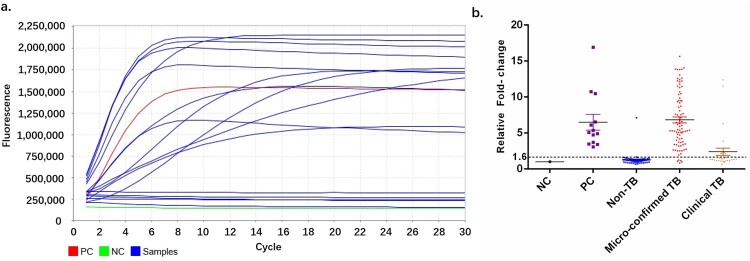
Figure 4.
Cut-off value determination. (a) Typical fluorescent signal curve was presented by ABI7500 QPCR machine. (b) Fluorescent signals from each samples and positive controls were normalized by negative control of same batch. The folds changed were put together according indicated groups. “Non TB”, patients diagnosed with no active MTB infection. “Micro-confirmed TB”, patients diagnosed with active MTB infection by either culture or Xpert or both. “Clinical TB”, patients diagnosed with active MTB infection following Diagnostic criteria and principles of management of infectious MTB without evidence of either culture or GeneXpert.

