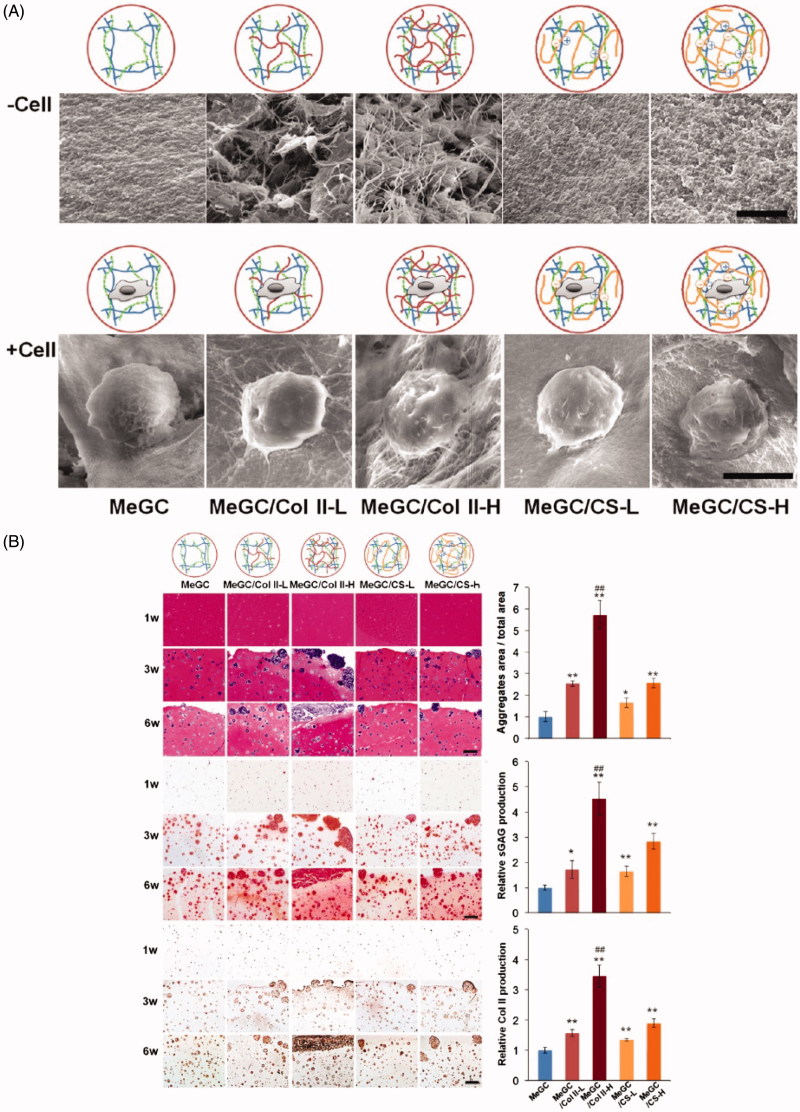
Figure 4.
Morphology of hydrogels and evaluation using 3D cultured chondrocytes via histological analysis. (A) SEM images of hydrogels showing the interior morphology of hydrogels (upper images, scale bar = 5 µm) and cell adhesion to the hydrogels (lower images, scale bar = 10 µm). (B) Histological analysis of chondrocytes in hydrogel systems during 6-week culture, including H&E (top images and quantified data of aggregate area at 6 weeks), safranin-O (middle images and quantified data of sGAG at 6 weeks), and immunohistochemical staining of Col II (bottom images and quantified data of Col II at 6 weeks) (scale bar = 200 µm). n = 3; *p < .05 and **p < .01 compared with MeGC; ##p < .01 compared with other groups. Reprinted with permission from Choi et al. (2014).

