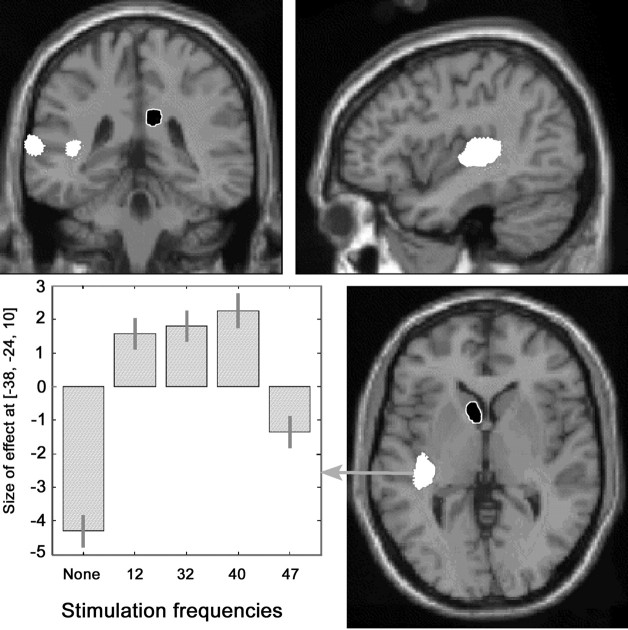
Fig. 3.
Anatomical location of areas with significant changes in rCBF during auditory stimulation (grouping of all frequencies compared with resting condition) projected on coronal, sagittal, and transverse sections of a T1-weighted canonical MRI of the human brain (increment in white and decrement inblack with white margin). Data are given in Table 1. The chart depicts the size of the effect of the parameter estimates weighted by the amplitude of the EEG steady-state auditory responses in the voxel of greatest activation (x, −36;y, −26; z, 10) at rest and at each of the four stimulation frequencies.

