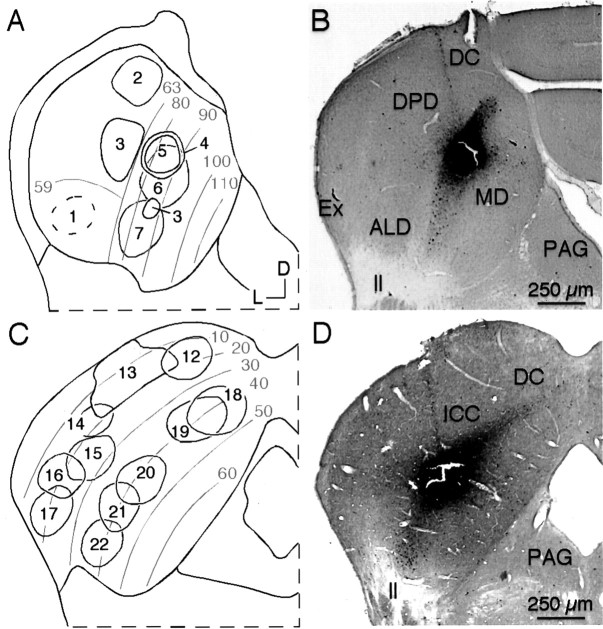
Fig. 2.
Location of tracer deposits and tonotopic organization in the IC of mustached bats (A,B) and pallid bats (C, D).A, Schematic view of the tonotopic organization in mustached bat's IC, with location of CTb tracer deposits indicated. Frequencies in lower part of audible range (10–59 kHz) are represented systematically in the anterolateral division (ALD) of ICC. The dorsoposterior division (DPD) disproportionately represents frequencies in the 59–63 kHz range, whereas frequencies >63 kHz are represented in the medial division (MD). B, Deposit of CTb in a mustached bat's ICC at site tuned to 86.1 kHz (case 5).C, Schematic view of the tonotopic organization of the pallid bat's IC, with the location of CTb tracer deposits indicated.D, Deposit of CTb in a pallid bat's ICC at site tuned to 41.9 kHz (case 20). In A andC, gray lines and textindicate isofrequency lines in the IC. Protocol for all photomicrographs is as follows (plan apochromat): NA 0.16.

