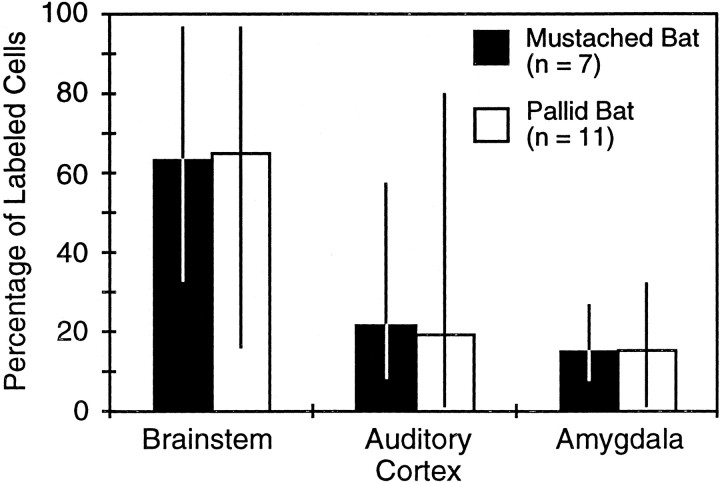
Fig. 7.
Comparison of retrograde labeling in brainstem, auditory cortex, and amygdala after CTb deposits in the IC of mustached bats and pallid bats. The relative distribution of label in the two species is nearly identical, despite wide variation among individual cases. Columns indicate average percentage of labeling in the three brain regions; vertical lines indicate the range of values.

