
Fig. 4.
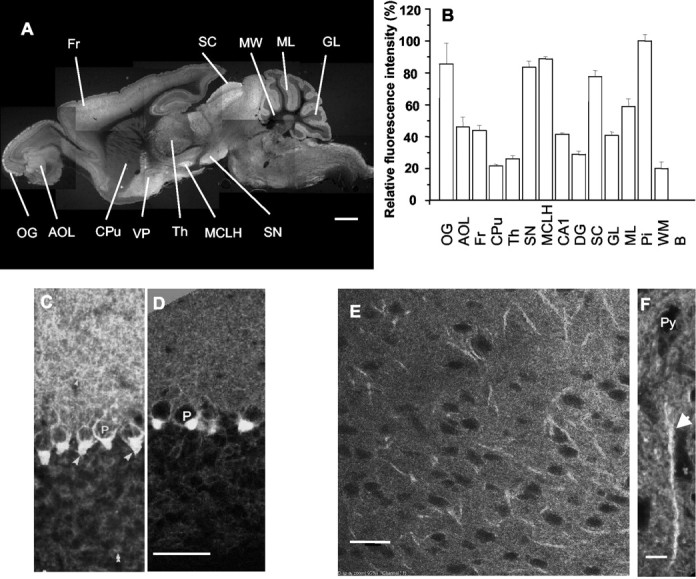
Overview of fluorescence in mGAT1–GFP mice.A, Montage forming a sagittal section ∼1.2 mm from the midline; homozygote. B, Relative mGAT1–GFP fluorescence intensity in various regions. C, D, Cerebellar cortex; comparison of previously published immunohistochemistry (C) (Radian et al., 1990), transformed to produce a negative image, with mGAT1–GFP expression (D); heterozygote, single confocal image from a 35 μm slice. E, F, Frontal cortex, layer 5/6. The linear objects are chandelier cell cartridges (F, arrow) surrounding the initial segments of pyramidal cells. E, Single confocal section from a heterozygote; F, projected stack (5 μm thick) from confocal sections of a homozygote. OG, Glomeruli of olfactory bulb; AOL, anterior olfactory nucleus;Fr, frontal cortex; Cpu, caudate putamen;Th, thalamus; SN, substantia nigra;MCLH, magnocellular nucleus of lateral hypothalamus;CA1, field of Ammon's horn in hippocampus;DG, dentate gyrus; SC, superior colliculus; GL, cerebellar granule layer;ML, cerebellar molecule layer; Pi, pinceaux; Py, pyramidal cell; WM, cerebellar white matter; EPI, external plexiform layer in olfactory bulb; VP, ventral pallidum. Scale bars:A, 1 mm; C–E, 50 μm;F, 10 μm.