
Fig. 4.
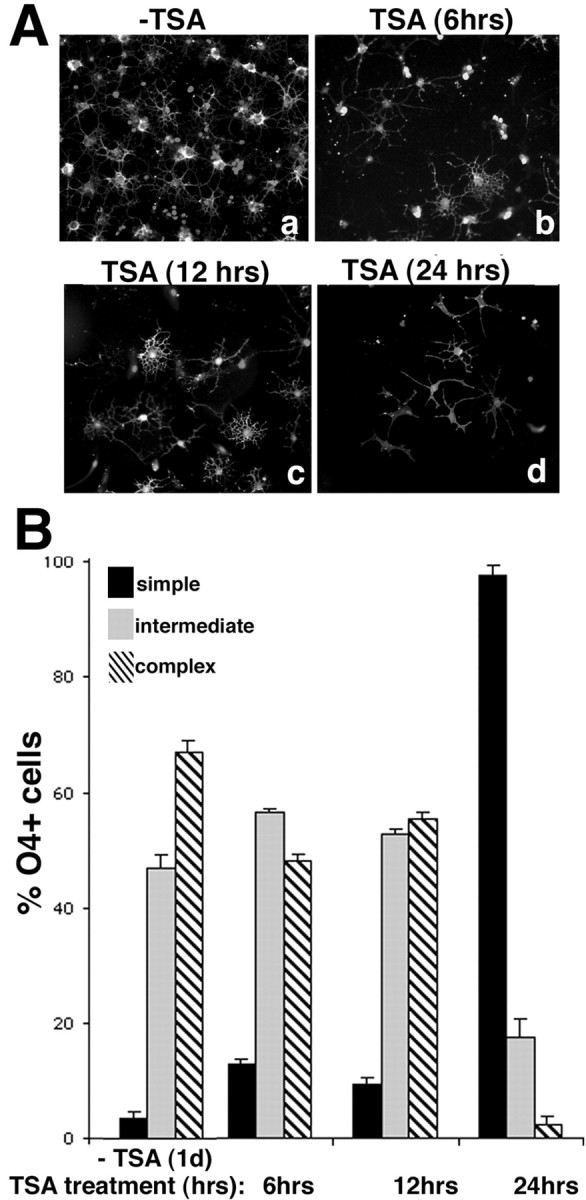
The effect of TSA is time dependent.A, Population analysis of the TSA-dependent effect. Photomicrograph of O4-positive cells cultured for 48 hr in medium without mitogens (a, −TSA) or cultured for 6 hr (b), 12 hr (c), or 24 hr (d) in the presence of 10 ng/ml TSA, followed by an additional 24 hr of culture in the absence of TSA. Cells were fixed and stained for O4. Stable changes were observed only after 24 hr treatment. B, Quantitation of the TSA-dependent effect. O4-positive cells were analyzed under a fluorescence microscope and classified as either simple, intermediate, or complex morphology, as described in Figure 3C. The bar graph represents the results of the counts from four to six determinations resulting from two or three experiments each performed in duplicate.