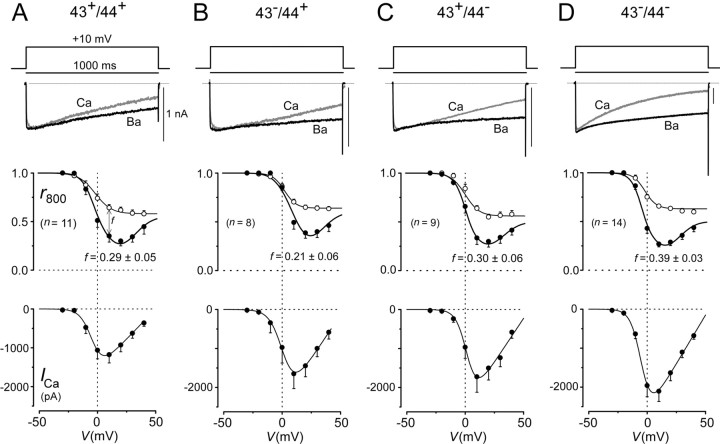
Fig. 5.
Splicing at exons 43 and 44 affects Ca2+ current amplitude and CDI.A–D, Top, One second depolarizing voltage pulse used to reveal CDI, along with exemplar Ba2+ and Ca2+ currenttraces. The gray trace was obtained with Ca2+ as the charge carrier; the black trace was obtained with Ba2+. Scale bar corresponds to the Ca2+ trace; Ba2+ traces were scaled downward to facilitate comparison of decay kinetics. Middle, Population averages (from n cells) for inactivation properties, as gauged by r800, the fraction of peak current remaining after an 800 msec depolarization plotted as a function of test pulse potential. Ca2+ data are plotted as filled symbols; Ba2+ data are plotted as open symbols. f is a metric for the strength of pure Ca2+-dependent inactivation, and mean values and SEM are shown. Bottom, Peak current versus test pulse potential with Ca2+as the charge carrier. Data were averaged from same cells as ther800 plot above. A versusD, Ca2+ current amplitude (bottom) and CDI are clearly greater in the 43−/44− versus 43+/44+ variant, with other splice forms showing intermediate behavior (B,C). No significant difference in the voltage dependence of activation or inactivation was observed. Half-activation voltages, as determined from current–voltage relationships (bottom) with Ca2+ as the charge carrier, were (in mV): −6.0 ± 1.6 (43+/44+; n = 8), 1.8 ± 0.7 (43−/44+;n = 4), −1.7 ± 1.3 (43+/44−; n= 5), and −5.6 ± 1.3 (43−/44−; n= 11). Half-inactivation voltages, as determined from 1 sec prepulse inactivation protocols with Ca2+ as the charge carrier, were (in mV): −2.4 ± 2.3 (43+/44+; n = 8), 6.5 ± 1.6 (43−/44+;n = 4), 0.1 ± 1.3 (43+/44−; n= 5), and −2.1 ± 1.1 (43−/44−; n= 11).

