Fig. 7.

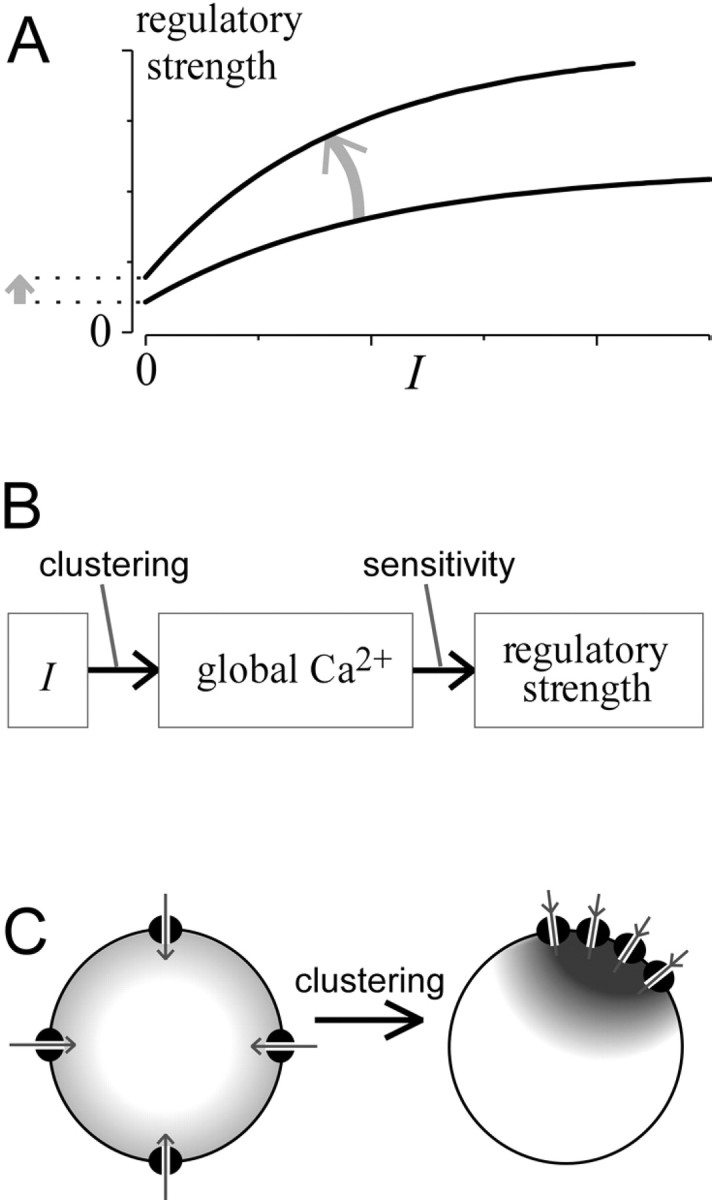
In-depth consideration of strength–current analysis. A, Theoretical curvesillustrating the anticipated shift (arrow) that would result from increased intrinsic Ca2+ sensitivity of a regulatory process for global Ca2+. The curvature of relationships reflects saturation of Ca2+responsiveness, the metric quantifying regulatory strength, or both.B, Underlying transformations connecting peak Ca2+ current amplitude (I) and regulatory strength. Increased intrinsic Ca2+ sensitivity would affect the second transformation, whereas cell-geometric factors such as channel clustering would affect the first. Changes in either transformation could impact the overall strength–current relationship.C, Diagram illustrating how increased channel clustering could enhance the transformation between I and the global Ca2+ signal relevant to channel regulation.
