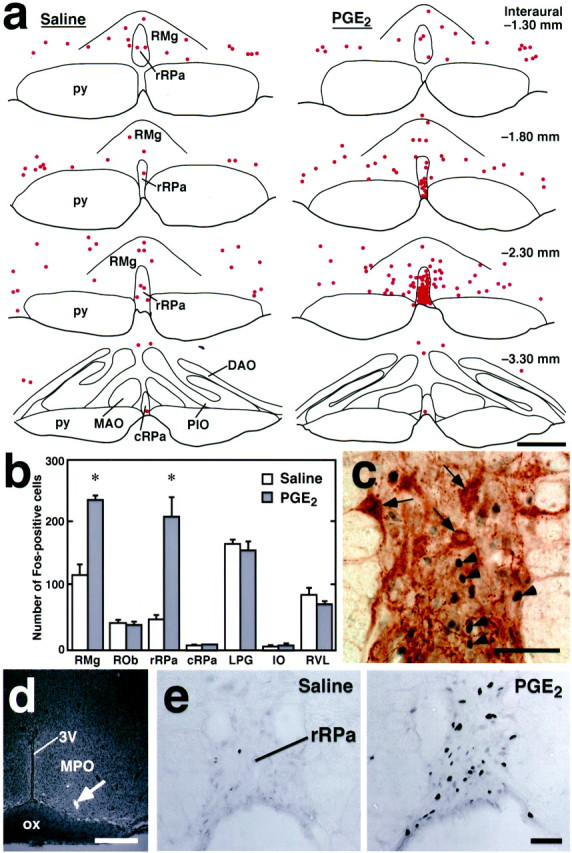
Fig. 1.

Central PGE2 stimulations induce Fos expression in rRPa neurons. a, Distribution of Fos-immunoreactive cells (dots) in the ventral medulla after intracerebroventricular injection of saline or PGE2. Fos-immunoreactive cells in a 20-μm-thick frontal section of the corresponding rostrocaudal position were plotted on a drawing. Sections set in a row were taken from the same rostrocaudal position, and their (Figure legend continued.) distances from the interaural line are indicated based on the brain atlas of Paxinos and Watson (1998). b, The numbers of Fos-positive cells in ventral medullary regions after intracerebroventricular injection of saline (white bars) or PGE2 (black bars). The numbers were counted in every sixth 20-μm-thick frontal section throughout the medulla oblongata. Eachbar represents the mean ± SEM of three rats per group. Asterisks indicate statistically significant differences between PGE2- and saline-injected groups (p < 0.05). c, Double-immunoperoxidase staining of Fos (blue-black) and serotonin (brown) in the rRPa (Interaural−2.30 mm) after intracerebroventricular PGE2 injection. Arrows andarrowheads indicate cells with serotonin and Fos immunoreactivity, respectively. d, A representative view of an intra-MPO microinjection site. The injection site was clearly identified as a cluster of fluorescent beads (arrow) in the section counterstained with toluidine blue. e, Fos immunoreactivity in the rRPa (Interaural −2.30 mm) after intra-MPO microinjection of saline or PGE2. 3V, Third ventricle;DAO, dorsal accessory olivary nucleus;MAO, medial accessory olivary nucleus;ox, optic chiasm; PIO, principal inferior olivary nucleus; py, pyramidal tract. Scale bars:a, d, 500 μm; c, 100 μm; e, 50 μm.
