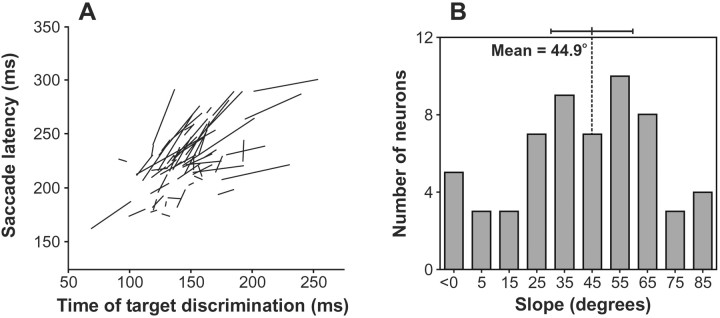
Fig. 9.
Summary of the relationship between the effect of repeating the target location on the time course of neuronal discrimination and on saccade latency. For each neuron, we plotted the median saccade latency for each of the two groups of trials described in Figure 8 as a function of the time of neuronal target discrimination for that group of trials. The line connecting these two points is plotted for each neuron in the left panel(A). The right panel(B) shows the distribution of the angular slope of these lines. The mean and 95% confidence interval are shown.

