
Fig. 2.
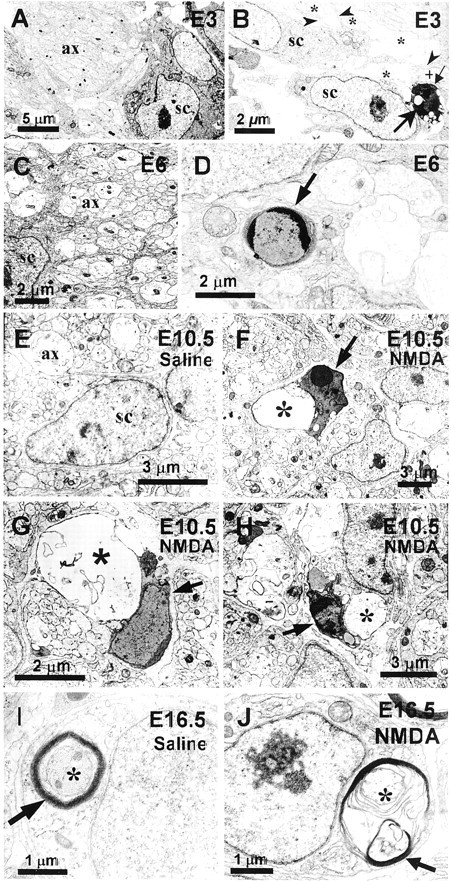
Ultrastructural analysis of Schwann cell death during normal development and after NMDA administration. Healthy Schwann cells (sc) are found associated with axons (ax) at E3 (A) and E6 (C). A Schwann cell undergoing PCD at E3 (large arrow) (B), exhibiting nuclear degradation and condensed chromatin, is separated from a healthy axon bundle (+) by a cellular process (small arrow), whereas, healthy Schwann cells (sc) are in close contact with normal bundles of axons (*) and in some cases extend processes between axons (arrowheads). Schwann cells undergoing PCD are also observed at E6 (D). Whereas E10.5 saline-treated embryos display healthy Schwann cells associated with normal axons bundles (ax) (E), dying Schwann cells (arrows) can often be found at E10.5, after NMDA treatment at E10, in close association with degenerating axons (*) (F–H). At E16.5 in saline-treated embryos, Schwann cells can be seen as ensheathing (arrow) normal axons (*) (I). However, at E16.5, after NMDA treatment on E16, Schwann cells exhibit the morphology of Wallerian degeneration, in which deteriorating myelin (arrow) can be seen around a degenerating axon (*) (J).