
Fig. 2.
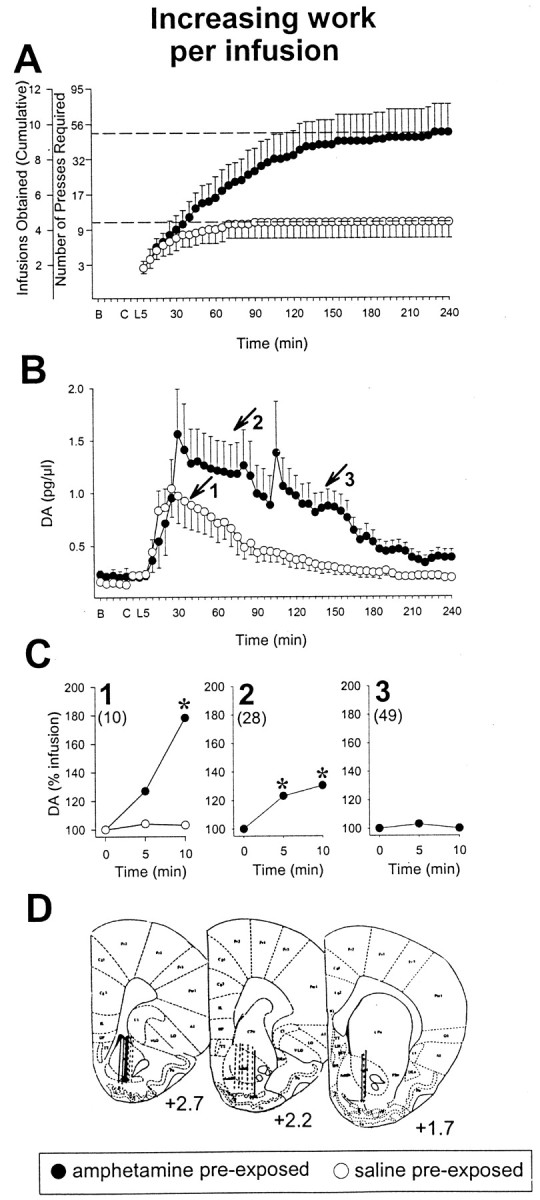
Rats previously exposed to amphetamine maintain responding and a significant drug-induced increase in NAcc DA for a longer period of time when self-administering the drug under a PR schedule requiring progressively increasing work to obtain successive infusions. A, Cumulative record of infusions obtained on the fourth to the fifth day of PR testing. Amphetamine pre-exposed rats obtained significantly more infusions than saline pre-exposed rats (dashed lines: 9.5 ± 1.6 vs 4.4 ± 0.9;p < 0.005). B, Baseline.C, Rats transferred to self-administration chamber.L, Lever inserted into chamber. B,Extracellular concentrations of DA in the NAcc before and during amphetamine self-administration during PR testing for rats described above. Data are shown as mean picograms per microliter (± SEM) plotted over time. Dialysate samples were collected every 5 min. Numbered arrows indicate the group mean time of 1, the last infusion (4.4 ± 0.9) obtained by saline pre-exposed rats, and the infusion marking when amphetamine pre-exposed rats had obtained 50% (4.5 ± 0.9) of the infusions they would obtain in the session, 2, the infusion marking when amphetamine pre-exposed rats had obtained 75% (7.5 ± 1.2) of their infusions, and 3, the last infusion (9.5 ± 1.6) obtained by amphetamine pre-exposed rats. Amphetamine pre-exposed rats continued to respond significantly longer than saline pre-exposed rats (p < 0.005).C, DA concentrations at (0 min) and after (5 and 10 min) the infusion obtained at times 1, 2, and3 in B. Data are plotted as a percentage of levels observed at the time of the individual infusion. Amphetamine, compared with saline, pre-exposed rats resisted the decline in the ability of the drug infusions to maintain a NAcc DA response.Numbers in parentheses indicate the increasing group mean number of lever presses required to obtain the respective infusions. *p values < 0.01–0.001 versus levels at the time of infusion as revealed by post hoc tests after ANOVA. D, Line drawings of coronal sections showing the location of the active portion of the microdialysis probes in the NAcc (solid lines, amphetamine pre-exposed; dashed lines, saline pre-exposed). Numbers indicate millimeters from bregma.n = 8–11 per group.