
Fig. 4.
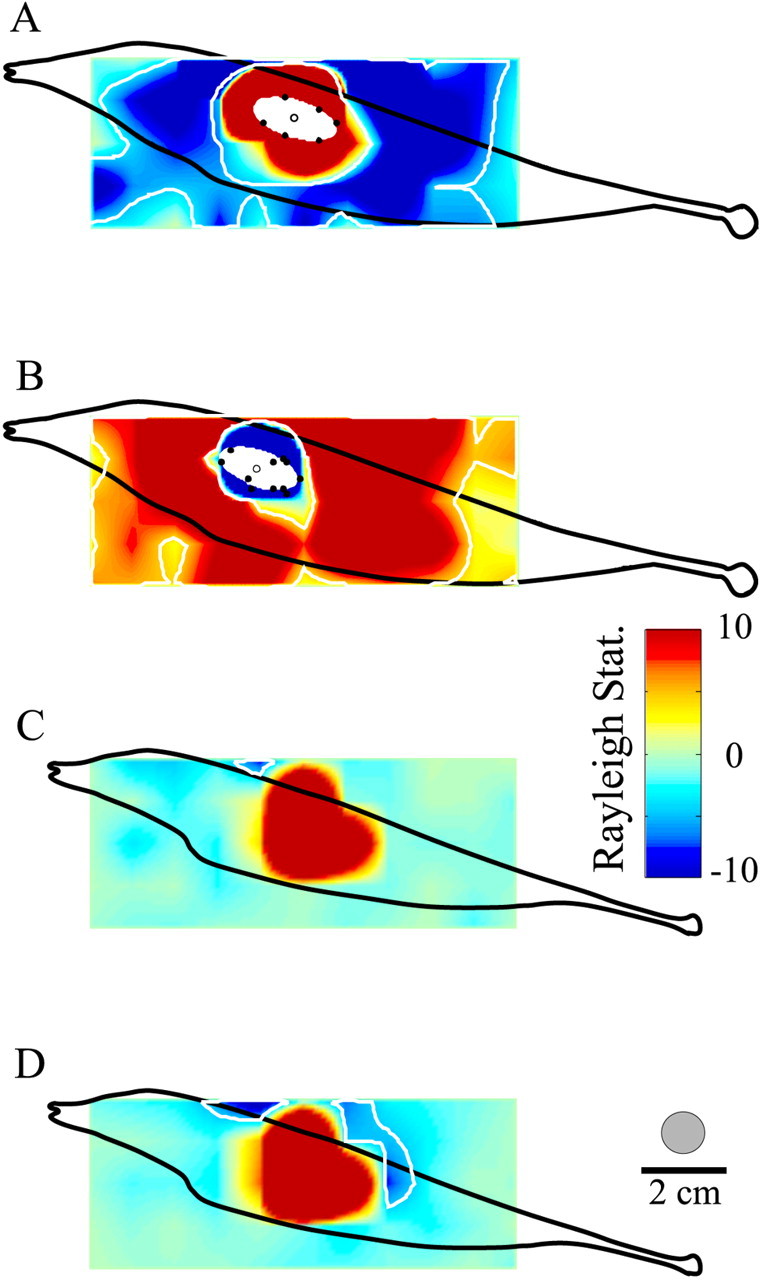
Pyramidal cell receptive field maps based on responses to sinusoidal AMs presented over an array of grid points.A, An E cell (18.8 sp/sec spontaneous rate; RF center area, 629 mm2; surround area, 3295 mm2). Whiteellipseshows RF center area (138 mm2) mapped as the best-fit ellipse to boundary points shown as black circles. B, An RF map for an 18.6 sp/sec I cell recorded from the same animal; center and surround areas, 296 and 3416 mm2, respectively. RF center areas determined from boundary points, 124.8 mm2. C, D, RF maps for a 27 sp/sec nonbursty E cell mapped with the standard stimulus intensity and with a 6 dB (∼2×) increase in amplitude, respectively. RF center and surround areas, 560 and 17 mm2, respectively, for the standard dipole stimulus; areas were increased to 591 and 227 mm2, respectively, with the stronger stimulus. Color maps were set to saturate at z-values of ±10. The gray circle indicates the spatial extent of the above-threshold stimulus attributable to the standard stimulus intensity determined from p-receptor afferent recordings.