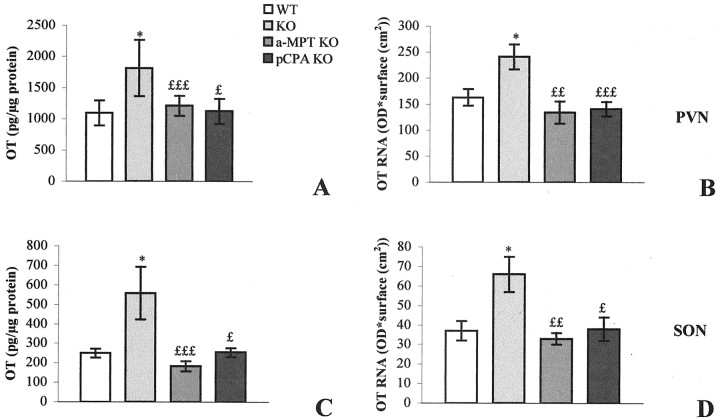
Fig. 8.
Enzyme immunoassay of OT (A, C) andin situ hybridization of OT mRNA (B, D) in the PVN (A, B) and the SON (C, D). Data are expressed as picograms of peptide/micrograms of protein (OT level) or as optical density × surface (cm2) (AVP mRNA) ± SEM; *p < 0.05 compared with C3H mouse value, using one-way ANOVA.£p < 0.05;££p < 0.01;£££p < 0.001 compared with saline-control Tg8 mouse value (which was equivalent to that of control Tg8 mice).

