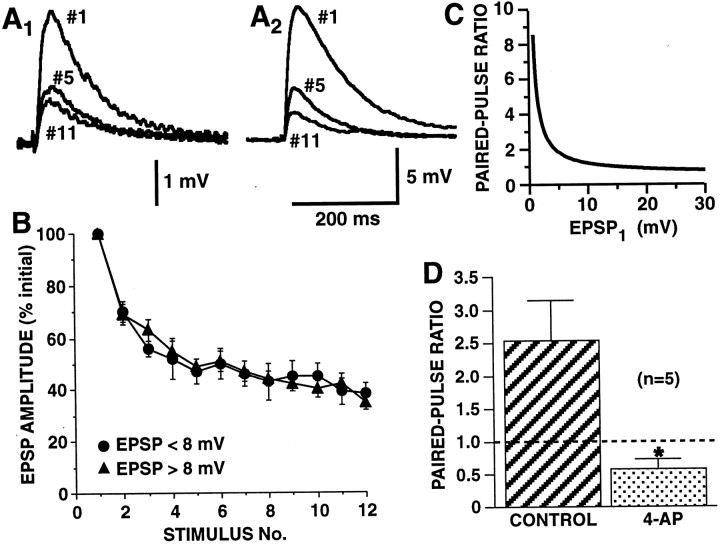
Fig. 2.
Strong and weak SN-to-MN synaptic connections undergo HSD with an identical time course, but differ in their paired-pulse ratios. A, B, Synapses were depressed by stimulating siphon SNs in the abdominal ganglion to fire single action potentials at a 15 sec interstimulus interval (ISI).A, Examples of HSD at a weak synapse (A1, initial amplitude = 3.2 mV) and a strong synapse (A2, initial amplitude = 12.5 mV). EPSPs are shown for the first, fifth, and eleventh stimuli. B, Group data on HSD for strong and weak synapses. Synaptic connections are grouped according to initial EPSP amplitudes as either strong (>8 mV) or weak (<8 mV) (mean EPSP on trial 1, 22.3 ± 2.1,n = 25, for strong synapses and 5.7 ± 0.3 mV,n = 10, for weak synapses). There was no significant difference in the time course of HSD between the two groups of synapses (repeated measure ANOVA testing interaction between initial EPSP amplitude and trial number,F(9,24) = 1.08, p = 0.42). In each experiment, EPSP amplitude is normalized to the amplitude of the EPSP on trial 1. Mean amplitude of all the EPSPs on trial 12 was 36 ± 3% of the initial amplitude. C,The inverse relationship between paired-pulse ratio and initial EPSP amplitude. Curve is hyperbolic function from Jiang and Abrams (1998), which was fit to empirical paired-pulse ratios for nondepressed SN synapses. Note, that, in contrast to initially weak synapses, initially strong synapses show relatively little paired-pulse facilitation, suggesting that these stronger synapses have higher release site probabilities. D, At weak synapses, increasing Ca2+ influx by broadening the SN spike eliminates paired-pulse facilitation. For control and 4-AP-treated synapses, after a weak synaptic connection was identified, ganglia were superfused with high divalent saline, with or without 2 mm 4-AP, for 15 min, and then tested with paired-pulse stimulation. With 4-AP, SN action potentials broadened 2.9 ± 0.23-fold, and initially weak connections (<8 mV EPSPs) increased 2.08 ± 0.31-fold (to >8 mV), and displayed no paired-pulse facilitation; the paired-pulse ratio was significantly different between the two groups (∗p < 0.02). Mean EPSP1 = 4.78 ± 2.17 mV for controls and 10.64 ± 1.53 mV for 4-AP, respectively. C,D, Each synapse was tested with paired-pulse stimulation (ISI, 50 msec) only once because of lability of paired-pulse facilitation at these synapses; thus, paired-pulse ratios for control and 4-AP were from different synapses in the same ganglia (n represents the number of ganglia). (For synapses treated with 4-AP, the strength of the synapse was measured with a single spike before the application of 4-AP; once 4-AP was applied, the synapses were not activated before the paired-pulse test.)

