
Fig. 6.
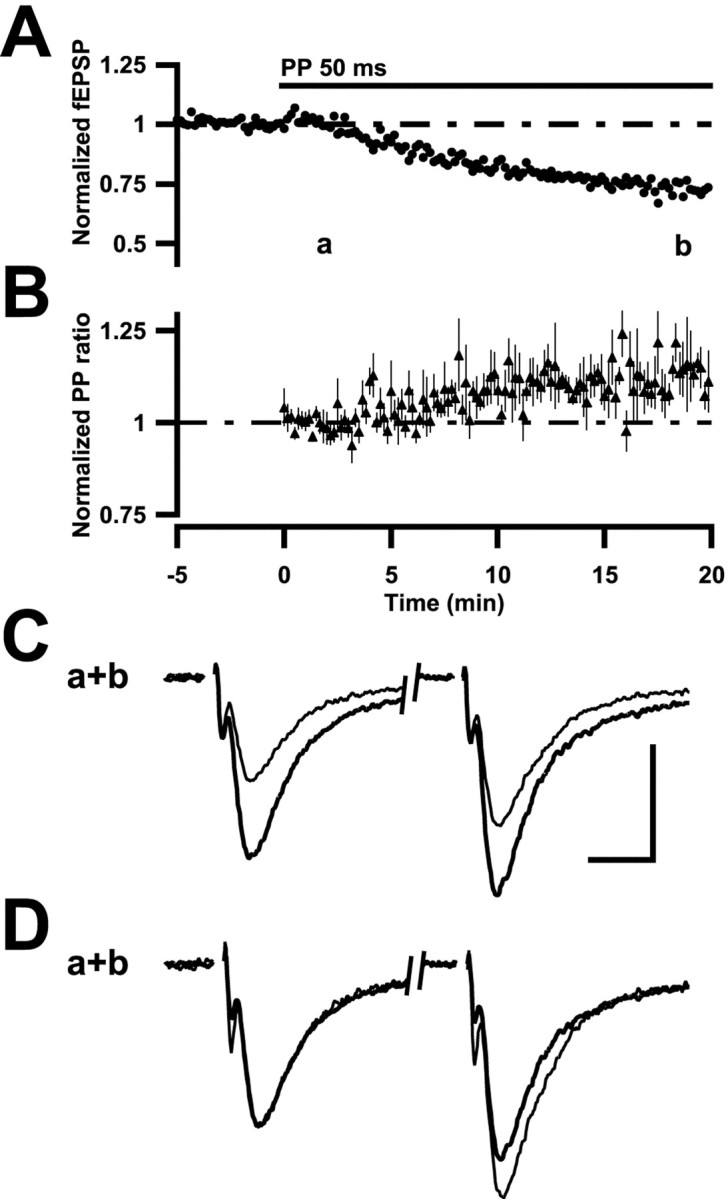
PP-induced LTD is associated with an increase in PPF. A, Summary plot, as described in Results and in Figure 1 (n = 6). B, PPF, normalized with respect to the average value obtained during the first 100 sec of PP stimulation, is plotted for the experiments illustrated in A. C, Averaged field EPSPs (n = 5) from a representative experiment taken at the times indicated by the characters (a; thick line, b; thin line). Calibration: 0.2 mV, 5 msec. D, Field EPSPs in C are shown after normalization with respect to the first EPSP.