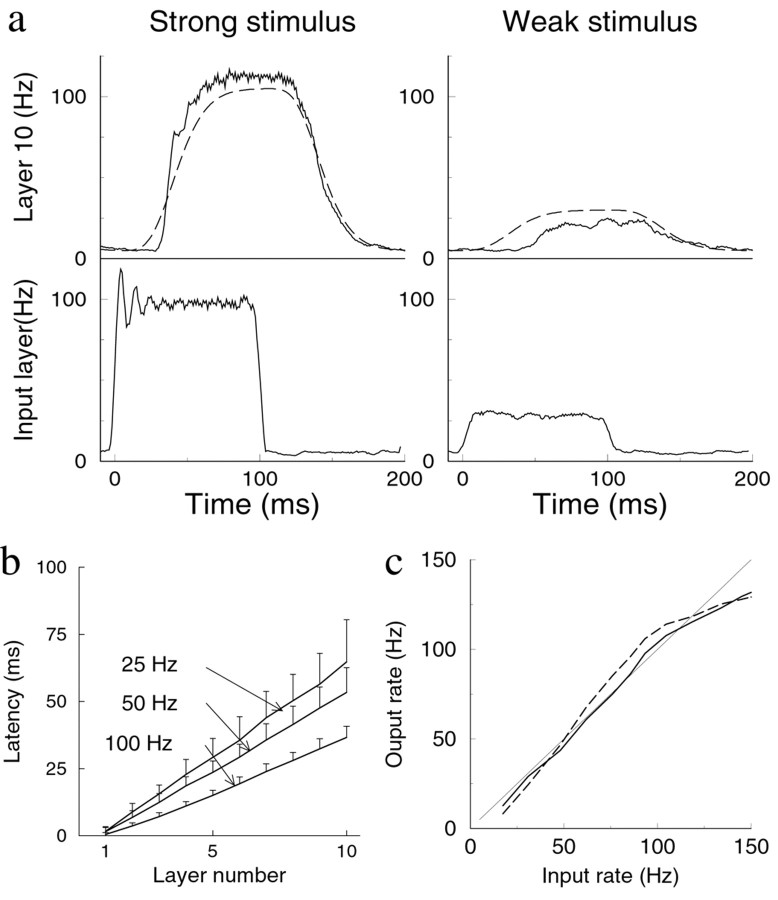
Fig. 3.
Speed and distortion of rate mode propagation. a, Response in the input layer (bottom panel) and in layer 10 (top panel; solid line) to a step current applied to the input layer. The response in the 10th layer is well described by filtering the input with nine consecutive low-pass filters with the synaptic time constant (dashed line; drawn with 5 Hz vertical offset to ease comparison). Left, Large-amplitude stimulus.Right, Small-amplitude stimulus. Response averaged over 100 runs. b, Latency of the network in response to step stimuli of different amplitudes. The latency, defined as the time between stimulus onset and 50% response, increases linearly with layer number. The latencies are longer for small-amplitude responses than for high-amplitude responses. Error bars indicate the response jitter, as given by SD of the latency across trials. c, The linearity of the response. A long-lasting step stimulus is applied. The firing rate in the fifth layer versus the average firing frequency in the input layer (solid line). The averaging started after the response onset in that layer and extended over the full layer.Dashed line denotes response in 10th layer. Thin solid line indicates identity (shown for comparison).

