
Fig. 2.
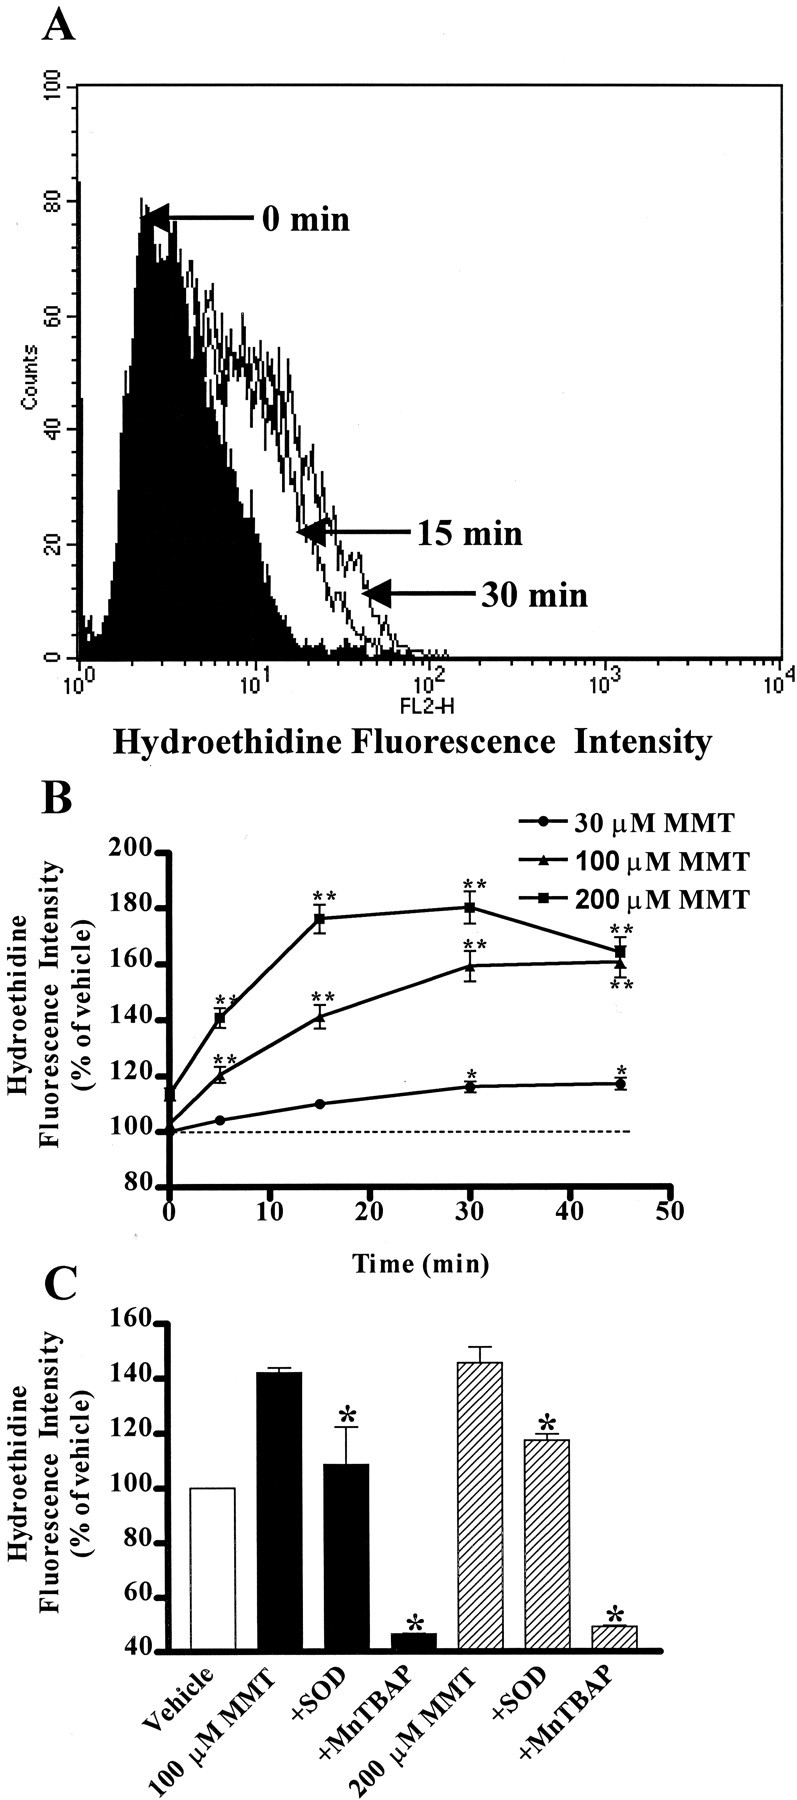
MMT treatment generates ROS in PC12 cells. PC12 cells were suspended in HBSS supplemented with 2 mmCa2+ at a density of 0.5–0.75 × 10⁶ cells/ml. A concentration of 10 μmhydroethidine was added to the cells and incubated for 15 min at 37°C in the dark. A, Time-dependent change in hydroethidine fluorescent intensity in PC12 cells treated with MMT. A concentration of 200 μm MMT was added, and fluorescent intensity was measured at 0, 15, and 30 min by flow cytometry as described in Materials and Methods. The data are a representative flow cytometric histogram of MMT-treated PC12 cells exhibiting a time-dependent increase in red fluorescence. B, Dose- and time-dependent increase in ROS production. Various doses of MMT were added, and fluorescent intensity was measured at 0, 5, 15, and 30 min. Data represent the mean ± SEM of two to five separate experiments in triplicate. Asterisks (*p < 0.5 and **p < 0.01) indicate significant differences compared with the time-matched vehicle-treated cells. C, Effect of SOD and MnTBAP on ROS production. Cells were pretreated with ROS inhibitors, SOD (100 U/ml) and MnTBAP (10 μm), and then exposed to 100 or 200 μm MMT for 15 min. The value of each treatment group is the mean ± SEM from two to three separate experiments performed in triplicate. Asterisks (*p < 0.05) indicate significant differences compared with MMT-treated cells.