Fig. 3.
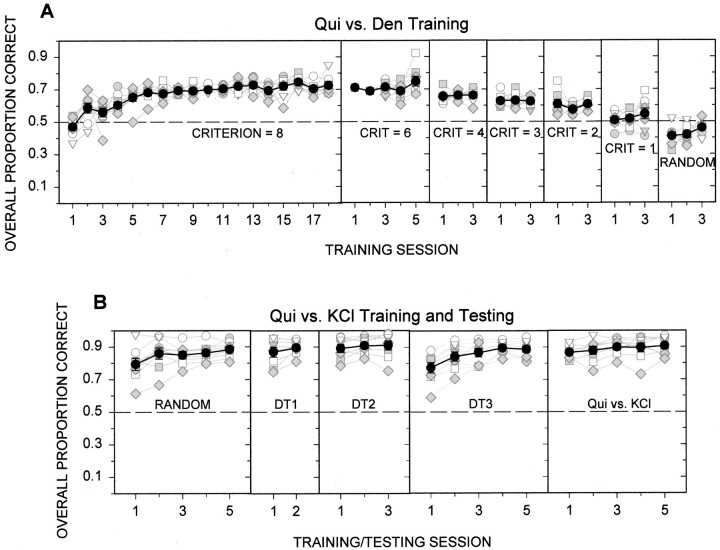
A, Individual animal (gray and white symbols) and group mean (± SE; black circles and bars) data for rats initially trained on a quinine versus denatonium discrimination (group 2) are plotted across training phases. Performance on all trials with a lever press is depicted averaged across all stimuli in a session. Once the alternation criterion during the correction procedure was lowered, performance progressively worsened until animals responded by chance when the stimuli were presented in randomized blocks. Because individual rats were tested for varying numbers of days at criteria 8 and 6, group means for these two criteria do not necessarily represent all animals (e.g., sessions 1 and 2 of criterion 6). It is clear that all of the rats could not learn this taste discrimination. B, The animals in group 2 were then trained and tested on a quinine versus KCl discrimination. Only the final phases of training and testing are shown. It is clear that these rats were able to learn a quinine versus KCl discrimination. All rats were included in all testing sessions. Because individual differences in performance were generally slight there is substantial overlap in symbols, making them difficult to discern in some cases. Chance performance equaled 0.5.

