
Fig. 3.
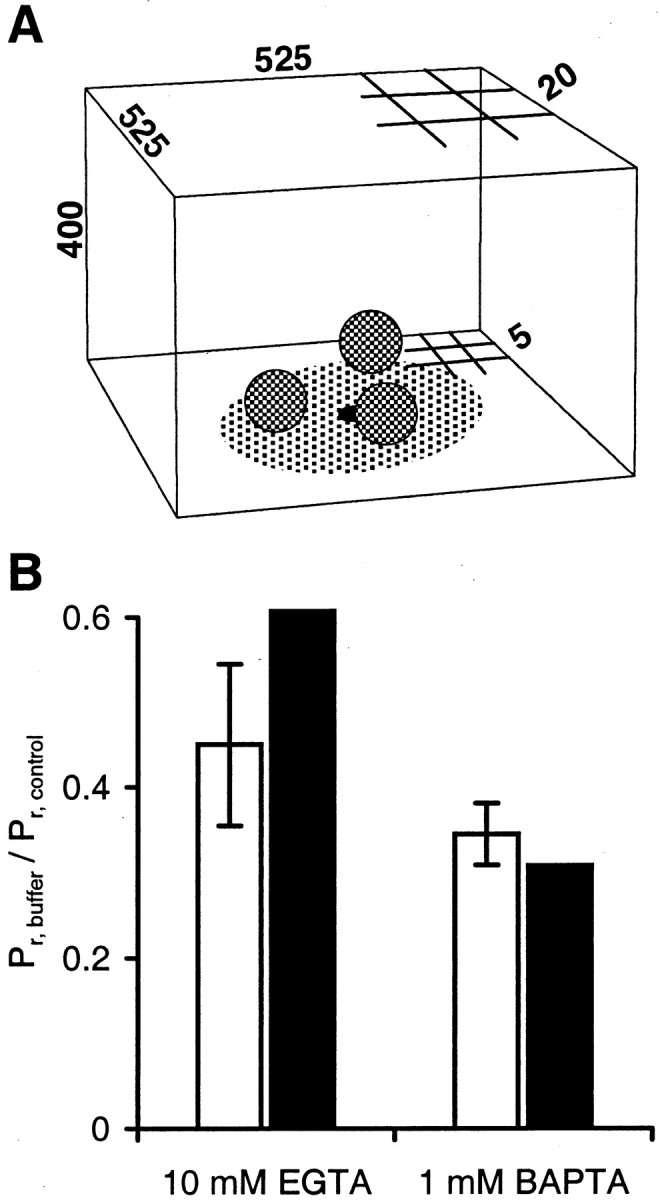
Measured buffer efficacies are reproduced (within ±2 SEM) when assuming variable channel-to-vesicle distance.A, Reaction volume used in the simulation; allnumbers are given in nanometers (not drawn to scale). Partial 5 and 20 nm grids indicate varying spatial resolution (see Materials and Methods). Single Ca2+ channel is located at the center in the first voxel layer on the membrane. Readily releasable vesicles (three examples shown) are located randomly anywhere on the AZ (all AZs are a circular area with a 125 nm radius centered on the Ca2+ channel). B, Comparison of model-predicted Pr with measured Pr. Filled columns, Predicted average Pr, vesicle for added exogenous buffer as ratio of control [control = endogenous fixed buffer (EFB) and ATP only]. Open columns, Measured data for calyx. Error bars indicate ± 1 SEM (see Table 2).