
Fig. 6.
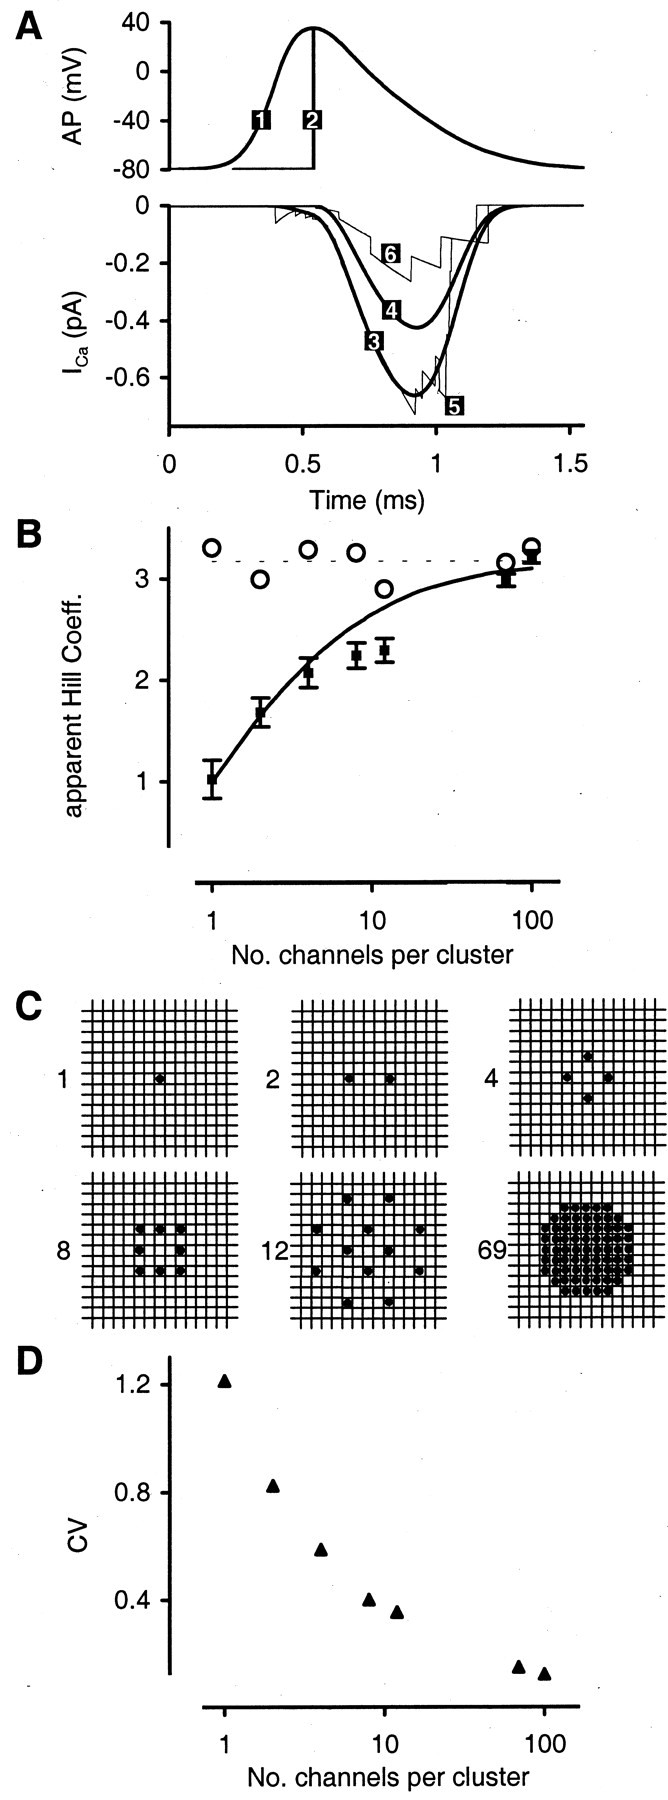
Effect of the number of Ca2+channels on release probability. A,ICa predicted by Hodgkin–Huxley Model for different AP waveforms. Trace 1, Physiological AP.Trace 2, Step AP to reduce peak channel open probability (popen). Trace 3, Average ICa (used in uniformiCa mode) for 12 channel cluster (physiological AP); half-width of ICa = 383 μsec; popen = 69%. Trace 4, Same as trace 3 but for step AP;popen = 42%. Trace 5, Example of stochastic ICa (used in stochastic iCa mode) for cluster of 12 channels (physiological AP). Trace 6, Same astrace 5 but for step AP. B, Effects of the number of channels per cluster on apparent Hill coefficientm (see Property III for details). Solid line, m predicted by time-independent model.Squares, m predicted by time-dependent model with the stochastic iCa mode (for allN the vesicle locations are as described for the reference topography). Error bars indicate ± SEM after 400 Monte Carlo simulations for each data point. Open circles, Apparent Hill coefficient predicted by time-dependent model with the uniform iCa mode.C, Number and position of Ca2+channels in clusters of different N (1–100) used in the simulation. Grid indicates (5 nm)3 voxels on the membrane; the black circles indicate a voxel with a channel. The cluster with N = 100 channels is the same as the cluster with N = 1 channel except that the same voxel holds 100 channels instead of 1 (unrealistic channel density). Reaction volume, as well as location of readily releasable vesicles and of cluster centers (indicated by the black circle inN = 1 cluster) on AZs, is as in Figure7A. D, Coefficient of variation of the total Ca2+ influx through a cluster [time integral of ICa(t), 0–5 msec] as a function of the number of channels per cluster (physiological AP waveform).