
Fig. 3.
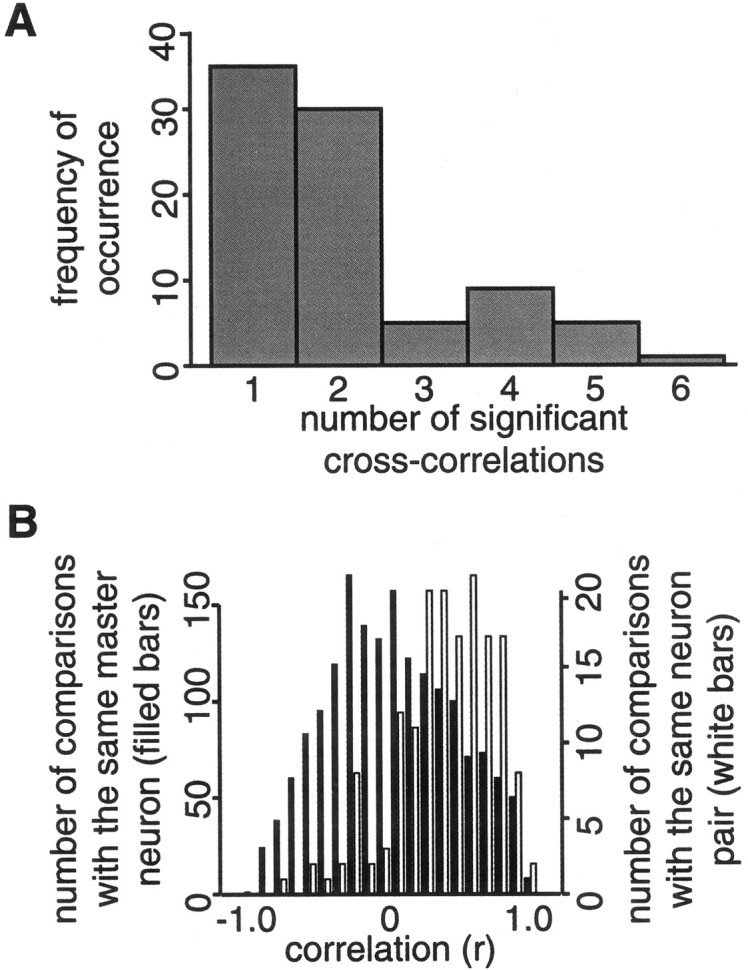
Summary of cross-correlation patterns in GC neuron pairs. A, Frequency histogram showing the number of significant cross-covariances, of a total possible six (one for each tastant), for each neuron pair. Most pairs only covaried in response to one or two tastants, but a substantial number covaried in response to four or five. B, Frequency histograms showing that CCs produced to different tastants by the same neuron pair tend to be similar (white bars), in that the Pearson'sr between such CCs tends to be greater than zero. For comparison, the black bars show the Pearson'sr between cross-covariances that share only one neuron in common; note that this distribution is centered on zero.