
Fig. 4.
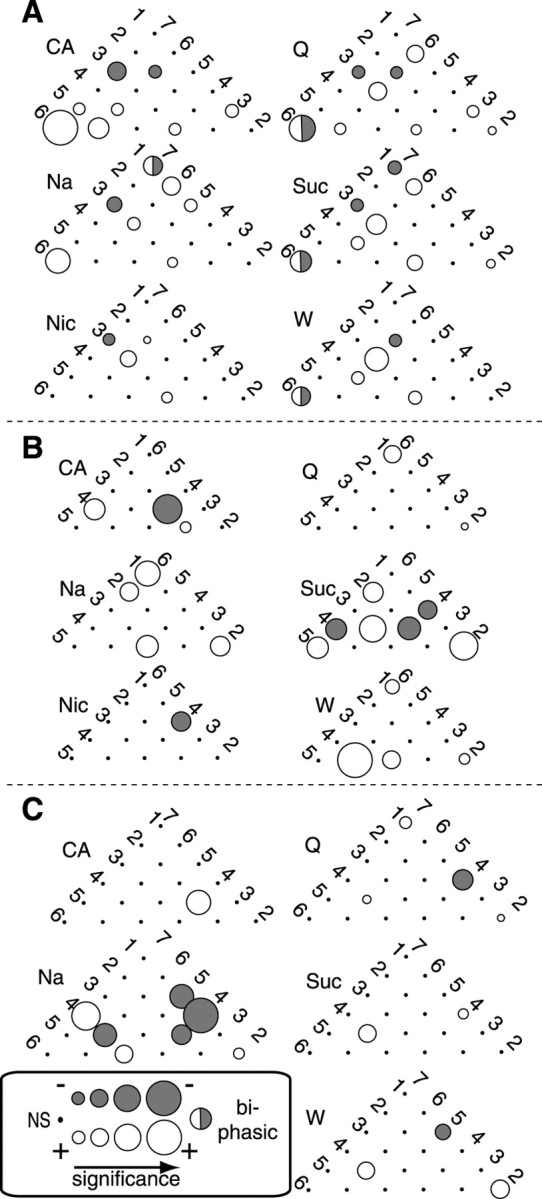
Taste-specific assemblies of interacting neurons.A–C, The half-matrix of the neuron pairs in three separate ensembles, showing which pairs produced significant CC peaks in response to the different tastants. Small black circles denote lack of significant interaction, and the sizes of shaded circles denote relative significance level.White circles denote excitatory interactions, anddark gray circles denote inhibitory interactions (for the rare neuron pairs that showed biphasically significant CCs, the size of the circle refers to the most significant peak, and half of the circle is shown in eachshade). In virtually all cases, the assemblies for different tastants are distinct (some pairs interact to only one tastant) but overlap (some pairs interact for several tastants).