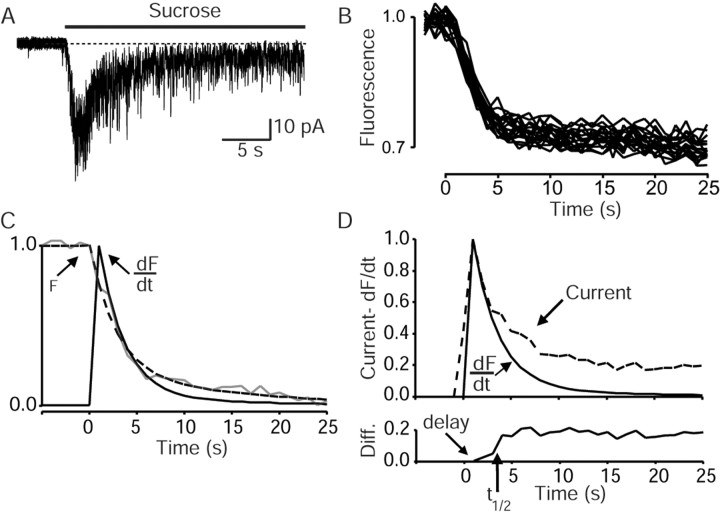
Fig. 5.
Evaluation of sucrose-induced release by simultaneous electrical recordings and fluorescence destaining.A, B, Whole-cell electrical recording of a sucrose response (A) and its instantaneous fluorescence counterpart from multiple boutons on the same neuron (B). C, Average fluorescence response (F, gray line) was smoothed by curve fitting (dashed line) to reduce noise, which in turn helped obtain a smooth derivative of the fluorescence signal (dF/dt, solid line). D, The difference between the rate of dye release and synaptic activity was assessed after alignment of the dF/dt and Current plots with respect to their peaks. Current plot was obtained by integrating current within 1 sec intervals. The difference shown in thebottom graph was interpreted as the time course of vesicle reuse.

