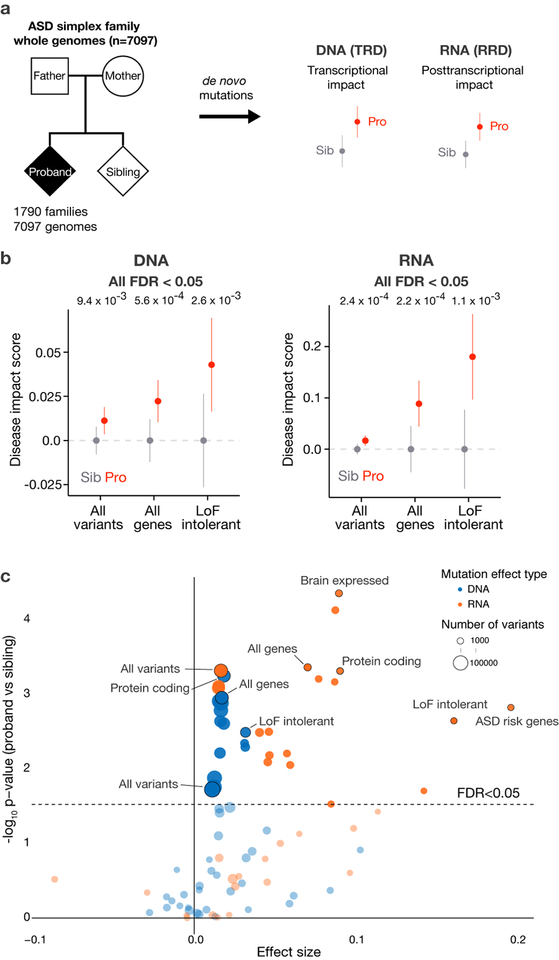
Fig. 1. The elevated noncoding regulatory mutation effect burden in Autism Spectrum Disorder.
a) Overall study design for deciphering the genome-wide de novo noncoding mutation effects contribution to ASD. 1,790 ASD simplex families’ whole genomes were sequenced to identify de novo mutations in the ASD probands and unaffected siblings. SNV de novo mutations were analyzed by their predicted transcriptional (chromatin and TFs) and post-transcriptional (RNA-binding proteins) regulatory effect for comparison between probands and siblings.
b) ASD probands possess mutations with significantly higher predicted disease impact scores compared to their unaffected siblings. We observe significant burden of both transcriptional (DNA - all variants, n = 127,140) and post-transcriptional regulation (RNA - all transcribed variants, n = 77,149) altering mutations in probands. This proband excess is stronger when restricted to mutation near all genes for DNA (n = 69,328) and near alternatively spliced exons for RNA (n = 4,871), and even stronger near ExAC LoF intolerant (DNA n = 14,873, RNA n = 1,355) genes. For analyses that include gene sets, variants were associated with the closest gene within 100kb of the representative TSS for transcriptional regulatory disruption (TRD) analysis. For RNA regulatory disruption (RRD) analysis, variants located in the introns within 400bp of flanking exons in alternative splicing regulatory regions were used. Wilcoxon rank sum test (one-sided) was used for computing the significance levels. All predicted disease impact scores were normalized by subtracting average predicted disease impact scores of sibling mutations for each comparison (mean DIS with the error bars indicate 95% CI). Every result is significant with multiple hypothesis correction (FDR < 0.05) and robust to inclusion or exclusion of protein coding region mutations (Supplementary Fig. 6).
c)Genomic variant set analysis of mutational burden for transcriptional- and posttranscriptional- disruptions. x-axis shows, for each gene set and distance cutoff, the effect size as defined as the difference between average DIS in probands and in siblings. Wilcoxon rank sum test (one-sided) was used for computing the significance levels. Significance level before and after correction for each category is listed in Supplementary Table 2. Categories shown in Fig. 1b are included in the annotation. All gene lists were obtained from Werling et al.17. Distance cutoffs for DNA are 10kb, 50kb, 100kb, 500kb, ∞ to TSS, and distance cutoffs for RNA are 200bp, 400bp, ∞ to all exons or to all alternatively spliced exons. DNA results shown in blue and RNA in orange; dot size corresponds to sample size (number of variants in a category); total sample size n = 127,140. Variant sets with >500 mutations are displayed. Full list of results are available in Supplementary Table 2. Uncorrected p-values are shown in the y-axis and the dashed line indicates categories below FDR 0.05 threshold with the Benjamini-Hochberg method. Results are robust to inclusion or exclusion of protein coding region mutations (Supplementary Fig. 7).

