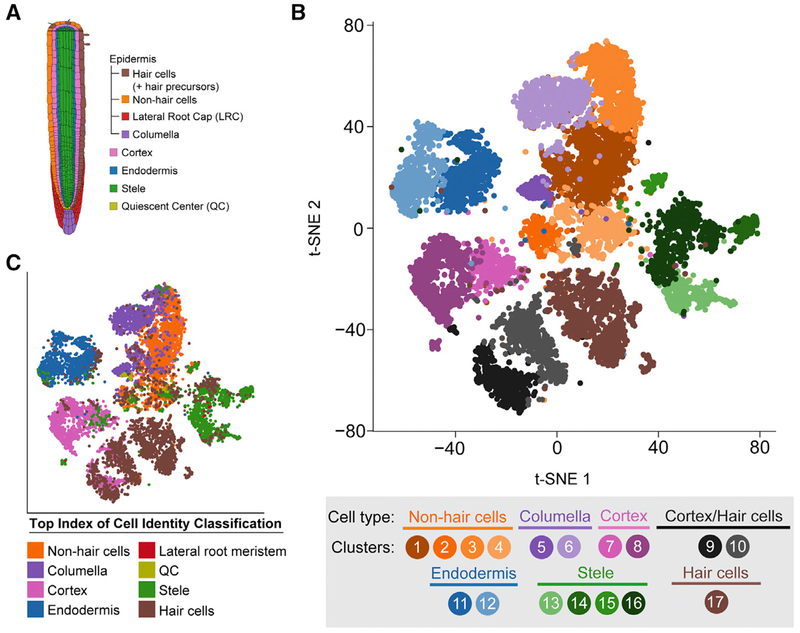
Figure 1. Single-Cell RNA-Seq of 12,198 Arabidopsis Root Cells Captures Diverse Cell Types.
(A) Cartoon representing the cell types that comprise the Arabidopsis root.
(B) t-Distributed Stochastic Neighbor Embedding (t-SNE) dimensional reduction of 12,198 single Arabidopsis root cells that were profiled using Drop-seq. Cells were clustered into 17 populations using Seurat (Butler et al., 2018). Points indicate individual cells and are colored by assigned cell type and cluster according to the legend.
(C) Same as (B), except colored according to the top index of cell identity (ICI) classification for each cell regardless of statistical significance. ICI assignments passing statistical significance are shown in Figures S3B and S3C.
See also Figures S1–S4 and Table S1.

