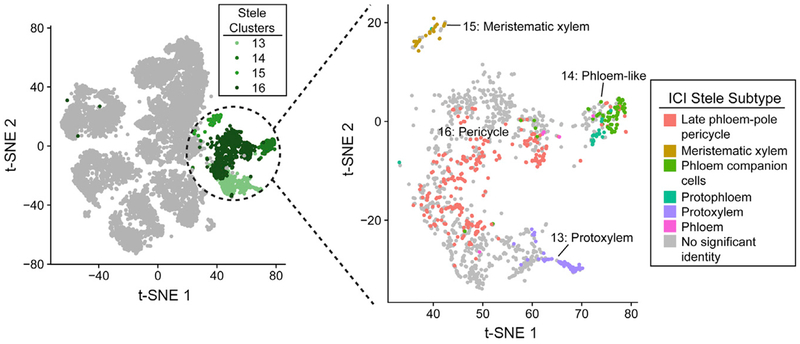
Figure 2. Stele Cell Subpopulations.
Left: t-SNE representation, as in Figure 1B, of all captured single cells, showing the stele clusters (13–16) colored in shades of green. Right: t-SNE showing just these stele clusters, with each cell colored by the stele subpopulation identity assigned by ICI. Gray cells had no stele cell type identity that reached statistical significance (p < 0.05).

