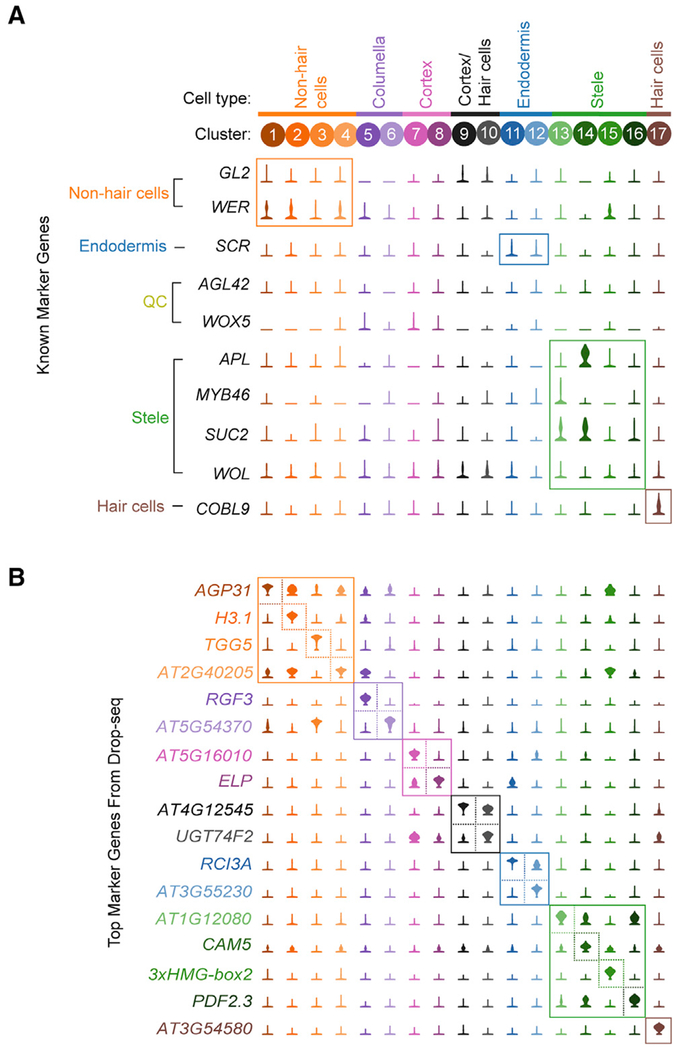
Figure 3. Identification of Highly Specific Cell Type Marker Genes.
(A) Violin plots showing the expression of 10 commonly used cell type marker genes across all clusters. Labels to the left of the gene names indicate the cell population each gene is used to designate.
(B) Violin plots showing the cluster-specific expression of the top-ranking novel candidate marker gene for each cell population identified by this study, color-coded as in Figure 1B.
See also Table S2.

