Figure 2.
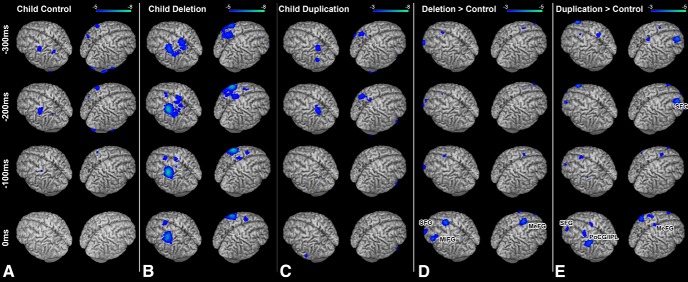
Response-locked (0 ms = button press) group analyses of changes in beta (12–30 Hz) oscillatory power during linguistic categorization. A, Within-group analysis (one-sample t test) of beta power in the control cohort. Robust (p < 0.05 FWE) reductions in beta power are seen over parietal and frontal motor cortices. B, Within-group analysis (one-sample t test of beta power) in the 16p11.2 deletion carrier cohort. C, Within-group analysis (one-sample t test of beta power) in the 16p11.2 duplication carrier cohort. Similar patterns of activation (p < 0.05 FWE) found in the control cohort are identifiable in both the deletion and duplication carrier cohorts. D, Comparison (unpaired nonparametric t test) between child control and child deletion carrier groups. Significant differences (p < 0.05 cluster-corrected) in beta power (in blue) are identifiable over the left MiFG, SFG, and MeFG, with greater beta power reductions in those regions for the child deletion carrier cohort. E, Comparison (unpaired nonparametric t test) between child duplication and child deletion carrier groups. Significant differences (p < 0.05, cluster-corrected) in beta power (in blue) are identifiable over the left and right SFG and PoCG and inferior parietal lobule (IPL). Conventions as in Figure 1.

