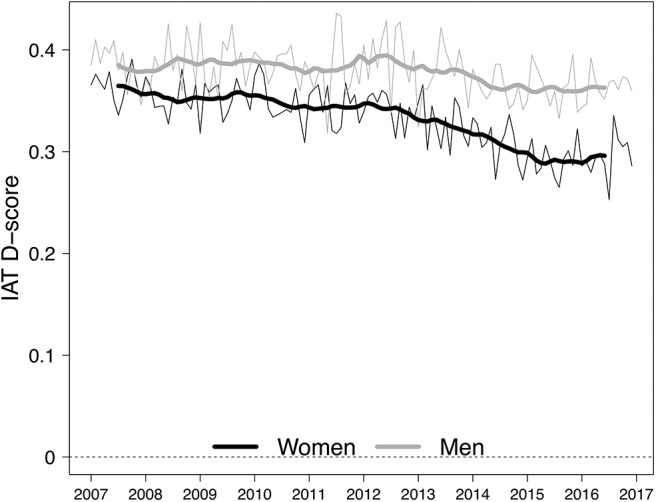
Figure 4.

Change over time in implicit men = science/women = arts stereotype, by gender (2005–2017). Weighted monthly means (weighting to control for sample change over time) are plotted in thin gray (for men) and black lines (for women). Decomposed trend lines (removing seasonality and random noise) are plotted in thick gray (for men) and black lines (for women). Data from the Project Implicit Demonstration website. For compiled raw data and code, see https://osf.io/n9jca/. For further details on analysis method, including controls for alternative explanations, such as sample change over time, see Charlesworth and Banaji (2019b).
