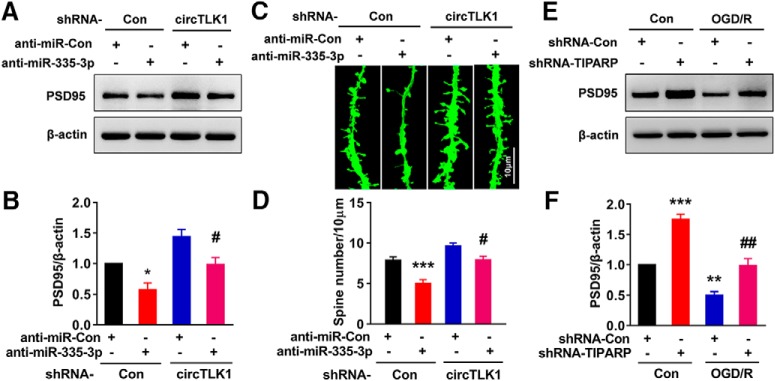
Figure 12.
The circTLK1/miR-335-3p axis impairs neuronal plasticity via the downstream protein TIPARP. A, B, Images (A) and bar graph (B) represent that the transduction of cortex neurons with the anti-miR-335-3p lentivirus significantly reduced the circTLK1 shRNA-induced increase in PSD95 levels, as determined by Western blot analyses. n = 4. shRNA-circTLK1: F(1,12) = 18.33, p = 0.0011; anti-miR-335-3p: F(1,12) = 19.82, p = 0.0008; interaction: F(1,12) = 0.02298, p = 0.8820. *p < 0.05 versus the group cotransduced with the circControl shRNA and anti-miR-Con. #p < 0.05 versus the group cotransduced with the circTLK1 shRNA and anti-miR-Con (two-way ANOVA followed by Holm–Sidak post hoc multiple-comparison tests). C, D, Images (C) and bar graph (D) represent that the transduction of cortical neurons with the anti-miR-335-3p lentivirus significantly reduced the circTLK1 shRNA-induced increase in spine density. n = 8. shRNA-circTLK1: F(1,28) = 29.84, p < 0.0001; anti-miR-335-3p: F(1,28) = 29.20, p < 0.0001; interaction: F(1,28) = 1.825, p = 0.1875. ***p < 0.001 versus the group cotransduced with circControl shRNA and anti-miR-Con. #p < 0.05 versus the group cotransduced with the circTLK1 shRNA and anti-miR-Con (two-way ANOVA followed by Holm–Sidak post hoc multiple-comparison tests). Scale bar, 10 μm. E, F, Images (E) and bar graph (F) represent that the TIPARP shRNA lentivirus attenuated the OGD/R-induced decrease in PSD95 levels. Cells were transduced with TIPARP shRNA lentiviruses for 7 d, treated with OGD for 2 h, and subjected to reperfusion for 6 h. n = 3. shRNA-TIPARP: F(1,8) = 62.21, p < 0.0001; OGD/R: F(1,8) = 65.63, p < 0.0001; interaction: F(1,8) = 2.909, p = 0.1265. **p < 0.01 versus the control shRNA-Con group. ***p < 0.001 versus the control shRNA-Con group. ##p < 0.01 versus the OGD/R-treated shRNA-Con group (two-way ANOVA followed by Holm–Sidak post hoc multiple-comparison tests). Images of whole blots presented in A, E are shown in Figure 12-1.

