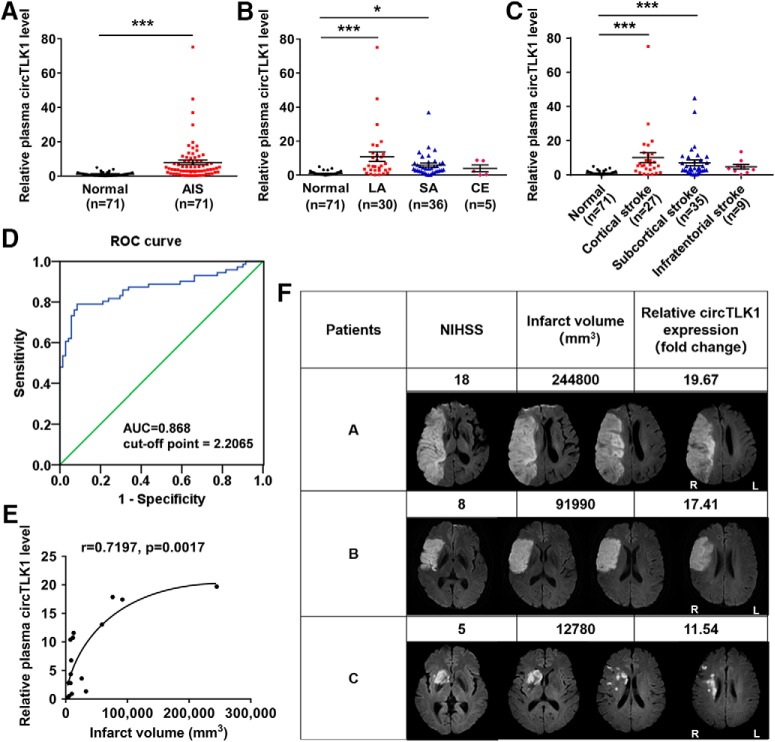
Figure 15.
circTLK1 is upregulated in the plasma of patients with AIS. A, Relative plasma circTLK1 levels in patients with AIS (n = 71) and healthy controls (n = 71), as measured by real-time PCR. t(140) = 5.067. ***p < 0.0001 (two-tailed t test). B, Relative plasma circTLK1 levels in patients with stroke classified according to the Trial of Org 10172 in Acute Stroke Treatment subtypes and healthy controls. F(3,138) = 11.45, p < 0.0001. *p < 0.05 versus the normal control group (one-way ANOVA followed by the Holm–Sidak test). ***p < 0.001 versus the normal control group (one-way ANOVA followed by the Holm–Sidak test). C, Relative plasma circTLK1 levels in patients with stroke categorized by lesion locations: Group A, cortical infarcts; Group B, subcortical infarcts; and Group C, infratentorial infarcts; and healthy controls. F(3,138) = 9.936, p < 0.0001. ***p < 0.001 versus the normal control group (one-way ANOVA followed by the Holm–Sidak test). D, Receiver operating characteristic curve of plasma circTLK1 levels for the diagnosis of AIS. E, The correlation between plasma circTLK1 levels and infarct volume. Patients with LA were recruited for infarct volume measurements. Correlations were estimated by calculating Pearson's correlation coefficients (r = 0.7197, p = 0.0017). Solid line was generated with a nonlinear regression analysis using Prism 6.0 (GraphPad). F, Representative data from 3 patients with different lesion patterns showing their NIHSS scores, lesion volumes, and relative plasma circTLK1 levels (fold change). R, Right hemisphere; L, left hemisphere. CE, cardioembolism; SA, small-artery occlusion; ROC, receiver operating characteristic; AUC, area under the curve.

