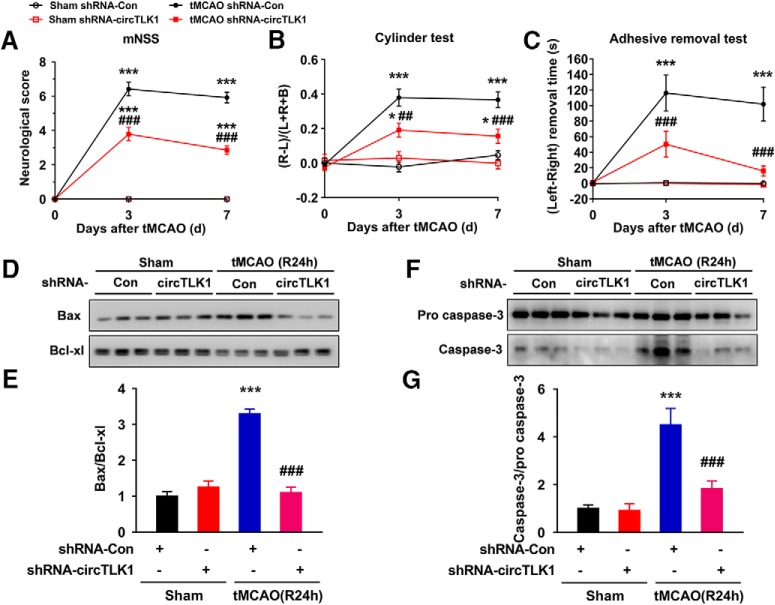
Figure 3.
circTLK1 knockdown ameliorates neurological deficits after focal ischemia in mice. A, Neurological deficits were measured by calculating the modified Neurological Severity Scores at 3 and 7 d after tMCAO. n = 9, 9, 12, and 14 animals in the sham + shRNA-Con, sham + shRNA-circTLK1, tMCAO + shRNA-Con, and tMCAO + shRNA-circTLK1 groups, respectively. shRNA-circTLK1: F(3,40) = 133.8, p < 0.0001; time: F(2,80) = 176.9, p < 0.0001; interaction: F(6,80) = 69.42, p < 0.0001; subjects (matching): F(40,80) = 2.037, p = 0.0035. ***p < 0.001 versus the sham + shRNA-Con group. ###p < 0.001 versus the tMCAO + shRNA-Con group (two-way repeated-measures ANOVA followed by Holm–Sidak post hoc multiple-comparison tests). B, Cylinder test of forelimb symmetry after stroke. L, Left; R, right; B, both forepaws. n = 9, 9, 12, and 14 animals in the sham + shRNA-Con, sham + shRNA-circTLK1, tMCAO + shRNA-Con, and tMCAO + shRNA-circTLK1 groups, respectively. shRNA-circTLK1: F(3,40) = 30.08, p < 0.0001; time: F(2,80) = 20.1, p < 0.0001; interaction: F(6,80) = 7.897, p < 0.0001; subjects (matching): F(40,80) = 0.8624, p = 0.6925. *p < 0.05 versus the sham + shRNA-Con group. ***p < 0.001 versus the sham + shRNA-Con group. ##p < 0.01 versus the tMCAO + shRNA-Con group (two-way repeated-measures ANOVA followed by Holm–Sidak post hoc multiple-comparison tests). ###p < 0.001 versus the tMCAO + shRNA-Con group (two-way repeated-measures ANOVA followed by Holm–Sidak post hoc multiple-comparison tests). C, Adhesive removal test of forelimb function at 3 and 7 d after tMCAO. n = 9, 9, 12, and 14 animals in the sham + shRNA-Con, sham + shRNA-circTLK1, tMCAO + shRNA-Con, and tMCAO + shRNA-circTLK1 groups, respectively. shRNA-circTLK1: F(3,40) = 21, p < 0.0001; time: F(2,80) = 12.62, p < 0.0001; interaction: F(6,80) = 6.75, p < 0.0001; subjects (matching): F(40,80) = 1.222, p = 0.2218. ***p < 0.001 versus the sham + shRNA-Con group. ###p < 0.001 versus the tMCAO + shRNA-Con group (two-way repeated-measures ANOVA followed by Holm–Sidak post hoc multiple-comparison tests). D, E, Western blot analysis of Bax and Bcl-xl levels in the ischemic cortex at 24 h after tMCAO. Representative images are shown in D. E, Transduction with circTLK1 shRNA lentiviruses attenuated the tMCAO-induced increase in the Bax/Bcl-xl ratio. n = 6 animals per group. Bax/Bcl-xl (shRNA-circTLK1: F(1,20) = 41.81, p < 0.0001; tMCAO: F(1,20) = 51.37, p < 0.0001; interaction: F(1,20) = 66.52, p < 0.0001). ***p < 0.001 versus the sham + shRNA-Con group. ###p < 0.001 versus the tMCAO + shRNA-Con group (two-way ANOVA followed by Holm–Sidak post hoc multiple-comparison tests). F, G, Western blot analysis of caspase-3 levels in the ischemic cortex at 24 h after tMCAO. Representative images are shown in F. G, Transduction of the circTLK1 shRNA lentiviruses attenuated the tMCAO-induced increase in the caspase-3/pro caspase-3 ratio. n = 6 animals per group. Caspase-3/pro caspase-3 (shRNA-circTLK1: F(1,20) = 10.98, p = 0.0035; tMCAO: F(1,20) = 28.35, p < 0.0001; interaction: F(1,20) = 9.811, p = 0.0052). ***p < 0.001 versus the sham + shRNA-Con group. ###p < 0.001 versus the tMCAO + shRNA-Con group (two-way ANOVA followed by Holm–Sidak post hoc multiple-comparison tests). Images of whole blots presented in D, F are shown in Figure 3-1.

