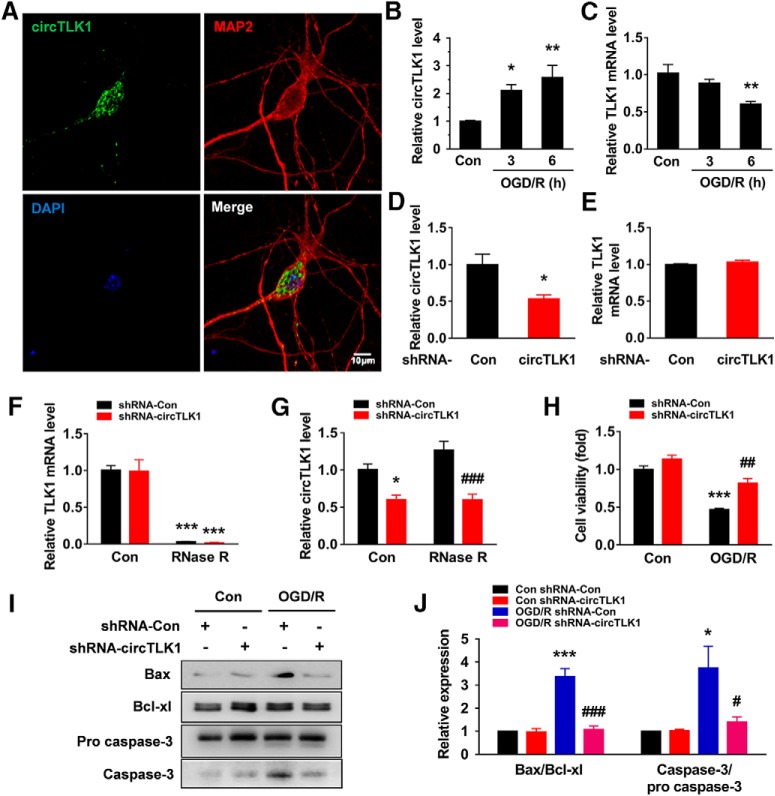
Figure 5.
circTLK1 knockdown ameliorates neuronal injury in vitro. A, circTLK1 expression in primary cortical neurons. The outline of the neuronal soma was identified using an antibody against MAP-2. Green represents circTLK1. Red represents MAP-2. Blue represents DAPI. Scale bar, 10 μm. B, Relative expression of circTLK1 in primary neurons after OGD/R. The cells were treated with OGD for 2 h and subjected to reperfusion for 3 or 6 h. n = 5. F(2,12) = 8.299, p = 0.0055. *p < 0.05 versus the control group (one-way ANOVA followed by the Holm–Sidak test). **p < 0.01 versus the control group (one-way ANOVA followed by the Holm–Sidak test). C, Relative expression of the TLK1 mRNA in primary neurons after OGD/R. Cells were treated with OGD for 2 h and subjected to reperfusion for 3 or 6 h. n = 4. F(2,9) = 7.848, p = 0.0106. **p < 0.01 versus the control group (one-way ANOVA followed by the Holm–Sidak test). D, Relative expression of circTLK1 in primary cortical neurons after circTLK1 shRNA lentivirus transduction, as determined by real-time PCR. Cells were transduced with the circTLK1 shRNA lentivirus for 7 d, and then the expression of circTLK1 was measured. n = 6. t(10) = 3.034. *p = 0.0126 (two-tailed t test). E, Relative expression of the TLK1 mRNA in primary mouse cortical neurons after circTLK1 shRNA lentivirus transduction, as measured using real-time PCR. Cells were transduced with the circTLK1 shRNA lentivirus for 7 d, and the expression of the TLK1 mRNA was then measured. Transduction of the circTLK1 shRNA lentivirus did not alter levels of the TLK1 mRNA. n = 3. F, G, Total RNA was extracted from circControl and circTLK1 shRNA lentivirus-transduced neurons and incubated with or without RNase R, followed by real-time PCR. The relative expression levels of the TLK1 mRNA (F) and circTLK1 (G) are shown. n = 4. TLK1 mRNA (shRNA-circTLK1: F(1,12) = 0.02594, p = 0.8747; RNase R: F(1,12) = 137.8, p < 0.0001; interaction: F(1,12) = 8.15e-005; p = 0.9929). circTLK1 (shRNA-circTLK1: F(1,12) = 41.38, p < 0.0001; RNase R: F(1,12) = 2.387, p = 0.1483; interaction: F(1,12) = 2.495, p = 0.1402). *p < 0.05 versus the no RNase R-treated (control) shRNA-Con group. ***p < 0.001 versus the no RNase R-treated (control) shRNA-Con group. ###p < 0.001 versus the RNase R-treated shRNA-Con group (two-way ANOVA followed by the Holm–Sidak test). H, The circTLK1 shRNA lentivirus attenuated the OGD/R-induced increase in cell injury, as measured by the CCK8 assay. Cells were transduced with circTLK1 shRNA lentiviruses for 7 d, treated with OGD for 2 h, and subjected to reperfusion for 6 h. n = 3. shRNA-circTLK1: F(1,8) = 25.88, p = 0.0009; OGD/R: F(1,8) = 79.74, p < 0.0001; interaction: F(1,8) = 5.086, p = 0.0541. ***p < 0.001 versus the control shRNA-Con group. ##p < 0.01 versus the OGD/R-treated shRNA-Con group (two-way ANOVA followed by Holm–Sidak post hoc multiple-comparison tests). I, J, The circTLK1 shRNA lentivirus attenuated the OGD/R-induced increase in the Bax/Bcl-xl ratio and caspase-3/pro caspase-3 ratio. Cells were transduced with circTLK1 shRNA lentiviruses for 7 d, treated with OGD for 2 h, and subjected to reperfusion for 6 h. n = 3. Bax/Bcl-xl (shRNA-circTLK1: F(1,8) = 31.85, p = 0.0005; OGD/R: F(1,8) = 35.80, p = 0.0003; interaction: F(1,8) = 30.48, p = 0.0006). Caspase-3/pro caspase-3 (shRNA-circTLK1: F(1,8) = 5.588, p = 0.0457; OGD/R: F(1,8) = 10.04, p = 0.0132; interaction: F(1,8) = 5.836, p = 0.0421). *p < 0.05 versus the control shRNA-Con group. ***p < 0.001 versus the control shRNA-Con group. #p < 0.05 versus the OGD/R-treated shRNA-Con group (two-way ANOVA followed by Holm–Sidak post hoc multiple-comparison tests). ###p < 0.001 versus the OGD/R-treated shRNA-Con group (two-way ANOVA followed by Holm–Sidak post hoc multiple-comparison tests). For the expression of circTK1 in the ischemic cortex and primary cell cultures in mice, see Figure 5-1. For the effect of OGD/R on neuronal injury in primary cortical neurons, see Figure 5-2. Images of whole blots presented in I are shown in Figure 5-3.

