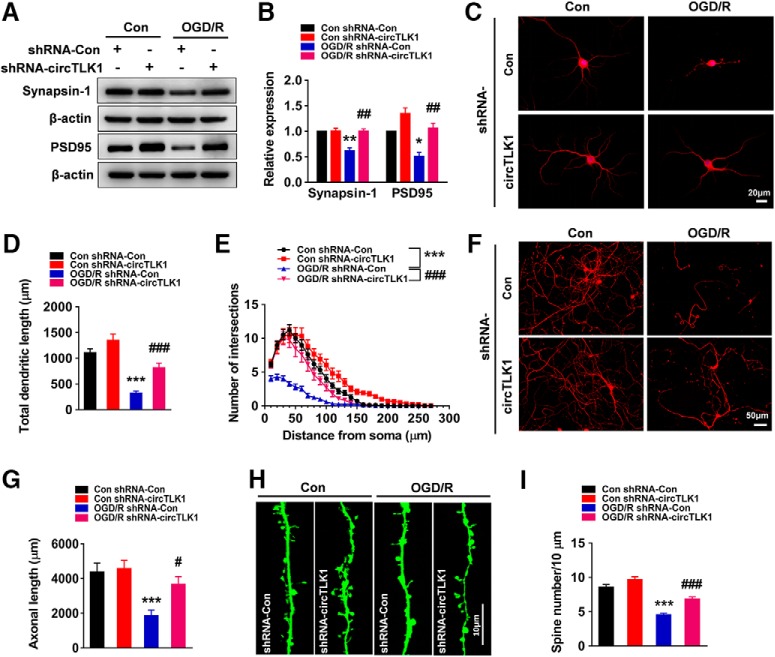
Figure 6.
Effect of circTLK1 on neuronal plasticity in primary cortical neurons after OGD/R. A, B, The circTLK1 shRNA lentivirus attenuated the OGD/R-induced decrease in SYN and PSD95 levels. Cells were transduced with the circTLK1 shRNA lentivirus for 7 d and subjected to OGD for 2 h and reperfusion for 6 h. n = 3. SYN (shRNA-circTLK1: F(1,8) = 20.70, p = 0.0019; OGD/R: F(1,8) = 19.67, p = 0.0022; interaction: F(1,8) = 18.67, p = 0.0025). PSD95 (shRNA-circTLK1: F(1,8) = 30.54, p = 0.0006; OGD/R: F(1,8) = 22.48, p = 0.0015; interaction: F(1,8) = 1.582, p = 0.2439). *p < 0.05 versus the control shRNA-Con group. **p < 0.01 versus the control shRNA-Con group. ##p < 0.01 versus the OGD/R-treated shRNA-Con group (two-way ANOVA followed by Holm–Sidak post hoc multiple-comparison tests). C, Representative images of cultured cortical neurons. D, Total dendritic length per neuron. E, Morphological characteristics of dendrites from neurons subjected to OGD for 2 h and reperfusion for 6 h were measured by Sholl analysis. The circTLK1 shRNA lentivirus attenuated OGD/R-induced decreases in dendritic complexity. Significant differences were observed at 10–100 μm from the soma. Fifteen neurons from three independent experiments were quantified. Total dendritic length (shRNA-circTLK1: F(1,56) = 18.86, p < 0.0001; OGD/R: F(1,56) = 60.25, p < 0.0001; interaction: F(1,56) = 2.297, p = 0.1352). ***p < 0.001 versus the control shRNA-Con group. ###p < 0.001 versus the OGD/R-treated shRNA-Con group (two-way ANOVA followed by Holm–Sidak post hoc multiple-comparison tests). Scale bar, 20 μm. F, G, Images (F) and bar graph (G) represent axonal outgrowth in primary cortical neurons after OGD/R. Axon length was measured 6 h after OGD. Fifteen images from three independent experiments were quantified. shRNA-circTLK1: F(1,56) = 5.168, p = 0.0269; OGD/R: F(1,56) = 15.12, p = 0.0003; interaction: F(1,56) = 3.308, p = 0.0743. ***p < 0.001 versus the control shRNA-Con group. #p < 0.05 versus the OGD/R-treated shRNA-Con group (two-way ANOVA followed by Holm–Sidak post hoc multiple-comparison tests). Scale bar, 50 μm. H, I, Images (H) and bar graph (I) represent the dendritic spine density of representative neurons. Twenty-six to 34 neurons from five independent experiments were quantified. shRNA-circTLK1: F(1,120) = 23.11, p < 0.0001; OGD/R: F(1,120) = 93.68, p < 0.0001; interaction: F(1,120) = 2.780, p = 0.0980. ***p < 0.001 versus the control shRNA-Con group. ###p < 0.001 versus the OGD/R-treated shRNA-Con group (two-way ANOVA followed by Holm–Sidak post hoc multiple-comparison tests). Scale bar, 10 μm. Images of whole blots presented in A are shown in Figure 6-1.

