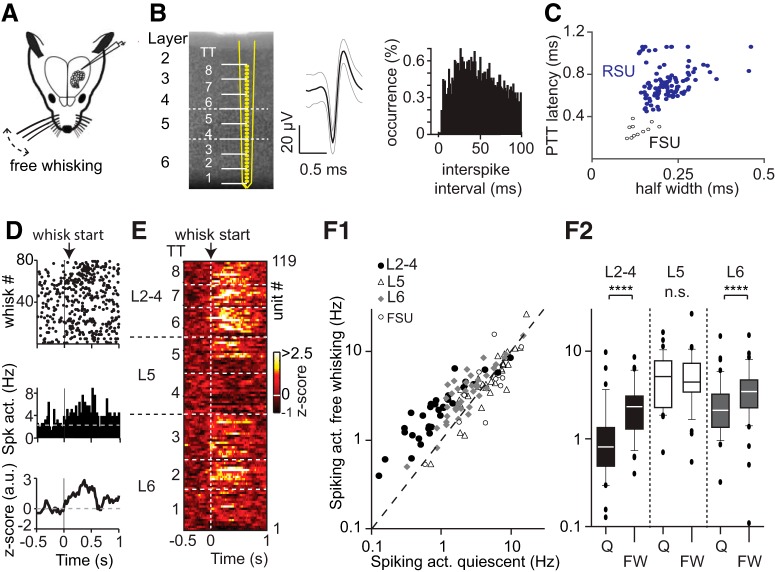
Figure 3.
Layer-specific representation of free whisking in PPC. A, Experimental design for silicon probe recordings across PPC layers to quantify modulation of spiking activity upon free whisking (FW). B, Left, Structural layout of the 32-channel silicon probe across PPC layers. White dashed lines indicate borders between L2–4, L5, and L6. Middle, Single-unit waveforms with mean (black solid) and SEM (gray) superimposed. Right, Histogram of interspike intervals for same unit. C, Scatterplot of AP half-width and peak-to-trough latency for individual clusters across extracellular recordings. Filled blue bullets represent RSUs (putative excitatory units, n = 108). Open bullets represent FSUs (putative inhibitory units, n = 11). D, Raster plot (top), PETH (middle), and z-transformed PETH (bottom) of an example unit from L2–4 aligned to FW onset. There is increased spiking activity during FW. E, Heat map of z-transformed spiking activity of all RSUs across PPC layers aligned to FW onset. Each row represents a single unit, arranged according to recording depth. White dashed lines indicate borders between tetrode groups. F1, Scatterplot with spiking activity during quiescent episodes (Hz) versus spiking activity during FW behavior (in Hz). F2, Box plots illustrating population statistics for spike modulation across PPC layers during FW. Spiking activity is significantly increased in L2–4 and L6 (Wilcoxon signed-ranks test, p < 0.0001 for both) but not in L5 (p > 0.05). n = 33 for L2–4, n = 33 for L5, and n = 42 for L6. ****p < 0.0001.

