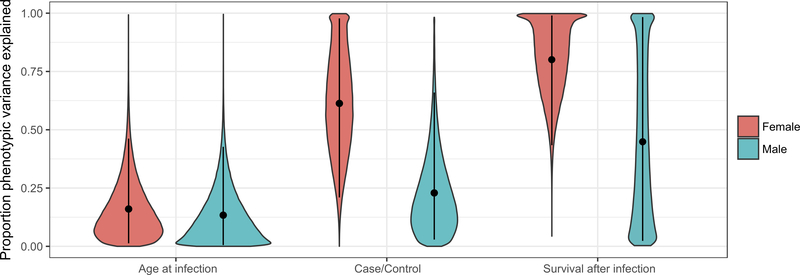
Figure 2.
The proportion of the phenotypic variance explained by all sequenced genotypes for three disease-related traits. We plotted the gemma posterior distribution of the proportion of phenotypic variance explained by all SNPs (y-axis) for each phenotype (x-axis) for females (pink) and males (blue) independently. Points indicate the mean of the distribution, and bars represent 95% posterior credible intervals.

