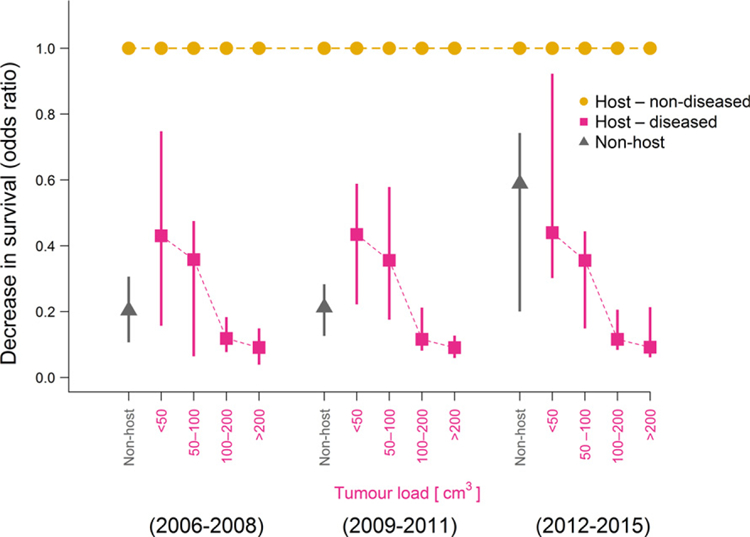
Figure 2.

Estimated decrease in survival rates for mature non-host individuals (i.e. those that never become infected; grey triangles) and host individuals with certain tumour loads (red squares) compared to non-diseased host individuals (i.e. prospective host individuals prior to the onset of tumour growth). Triangles and squares are posterior modes of the odds ratios of the survival rates compared to those of non-diseased host individuals (baseline value at 1, shown in orange), vertical bars are 95% credible intervals.
